Documentation Index
Fetch the complete documentation index at: https://mezmo-9a59581a-mintlify-926f893d.mintlify.app/llms.txt
Use this file to discover all available pages before exploring further.
Event Metrics
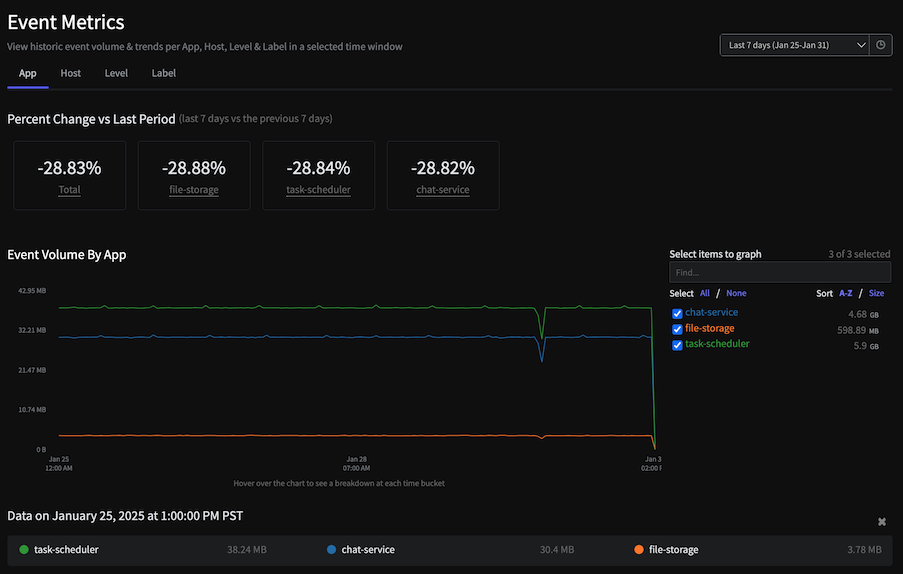
The Event Metrics view for a Pipeline shows historic event volume and trends perapp, host, level and label for a selected time window. This data is continuously updated based on the volume of telemetry streaming through the pipeline. There are two key components in this data:
- Line graph of log volume
-
Trends such as:
- % change (increase or decrease) of total volume in the selected time window
- Top 5
app,host,levelandlabelwith biggest change
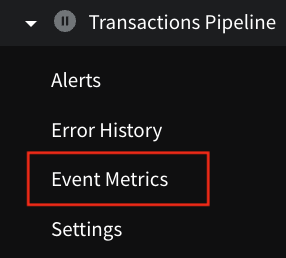
Becasue there can be unlimited number of apps or hosts, Event Metrics only collects and displays data for first 300 apps or hosts. Data is retained for 30 days, after which it is replaced by new data.You can view the Event Metrics for a Pipeline by clicking the arrow next to the name of the Pipeline, then selecting Event Metrics.