

Documentation Index
Fetch the complete documentation index at: https://mezmo-9a59581a-mintlify-926f893d.mintlify.app/llms.txt
Use this file to discover all available pages before exploring further.
Why it matters Log data can be incredibly valuable, but this is often dependent on context and time. By utilizing the Mezmo Data Profiles along with Responsive Pipelines and proper parsing, teams can ensure the right data shows up at the right time in the right place with the right format.
Step 1: Create a New Pipeline to Handle and Route OpenTelemetry Logs
We will begin by routing OpenTelemetry Logs to Mezmo Log Analysis. To do this while optimizing the data, create a new Mezmo Pipeline by clicking New Pipeline in the platform. Give this a name likeLog Handler.
Step 2: Add OpenTelemetry Log Source
ClickAdd Source and select your OpenTelemetry Log source from the Shared Sources list just like you did for the Exploration pipeline in the prior section.
Step 3: Insert State Enrichment and Normalize
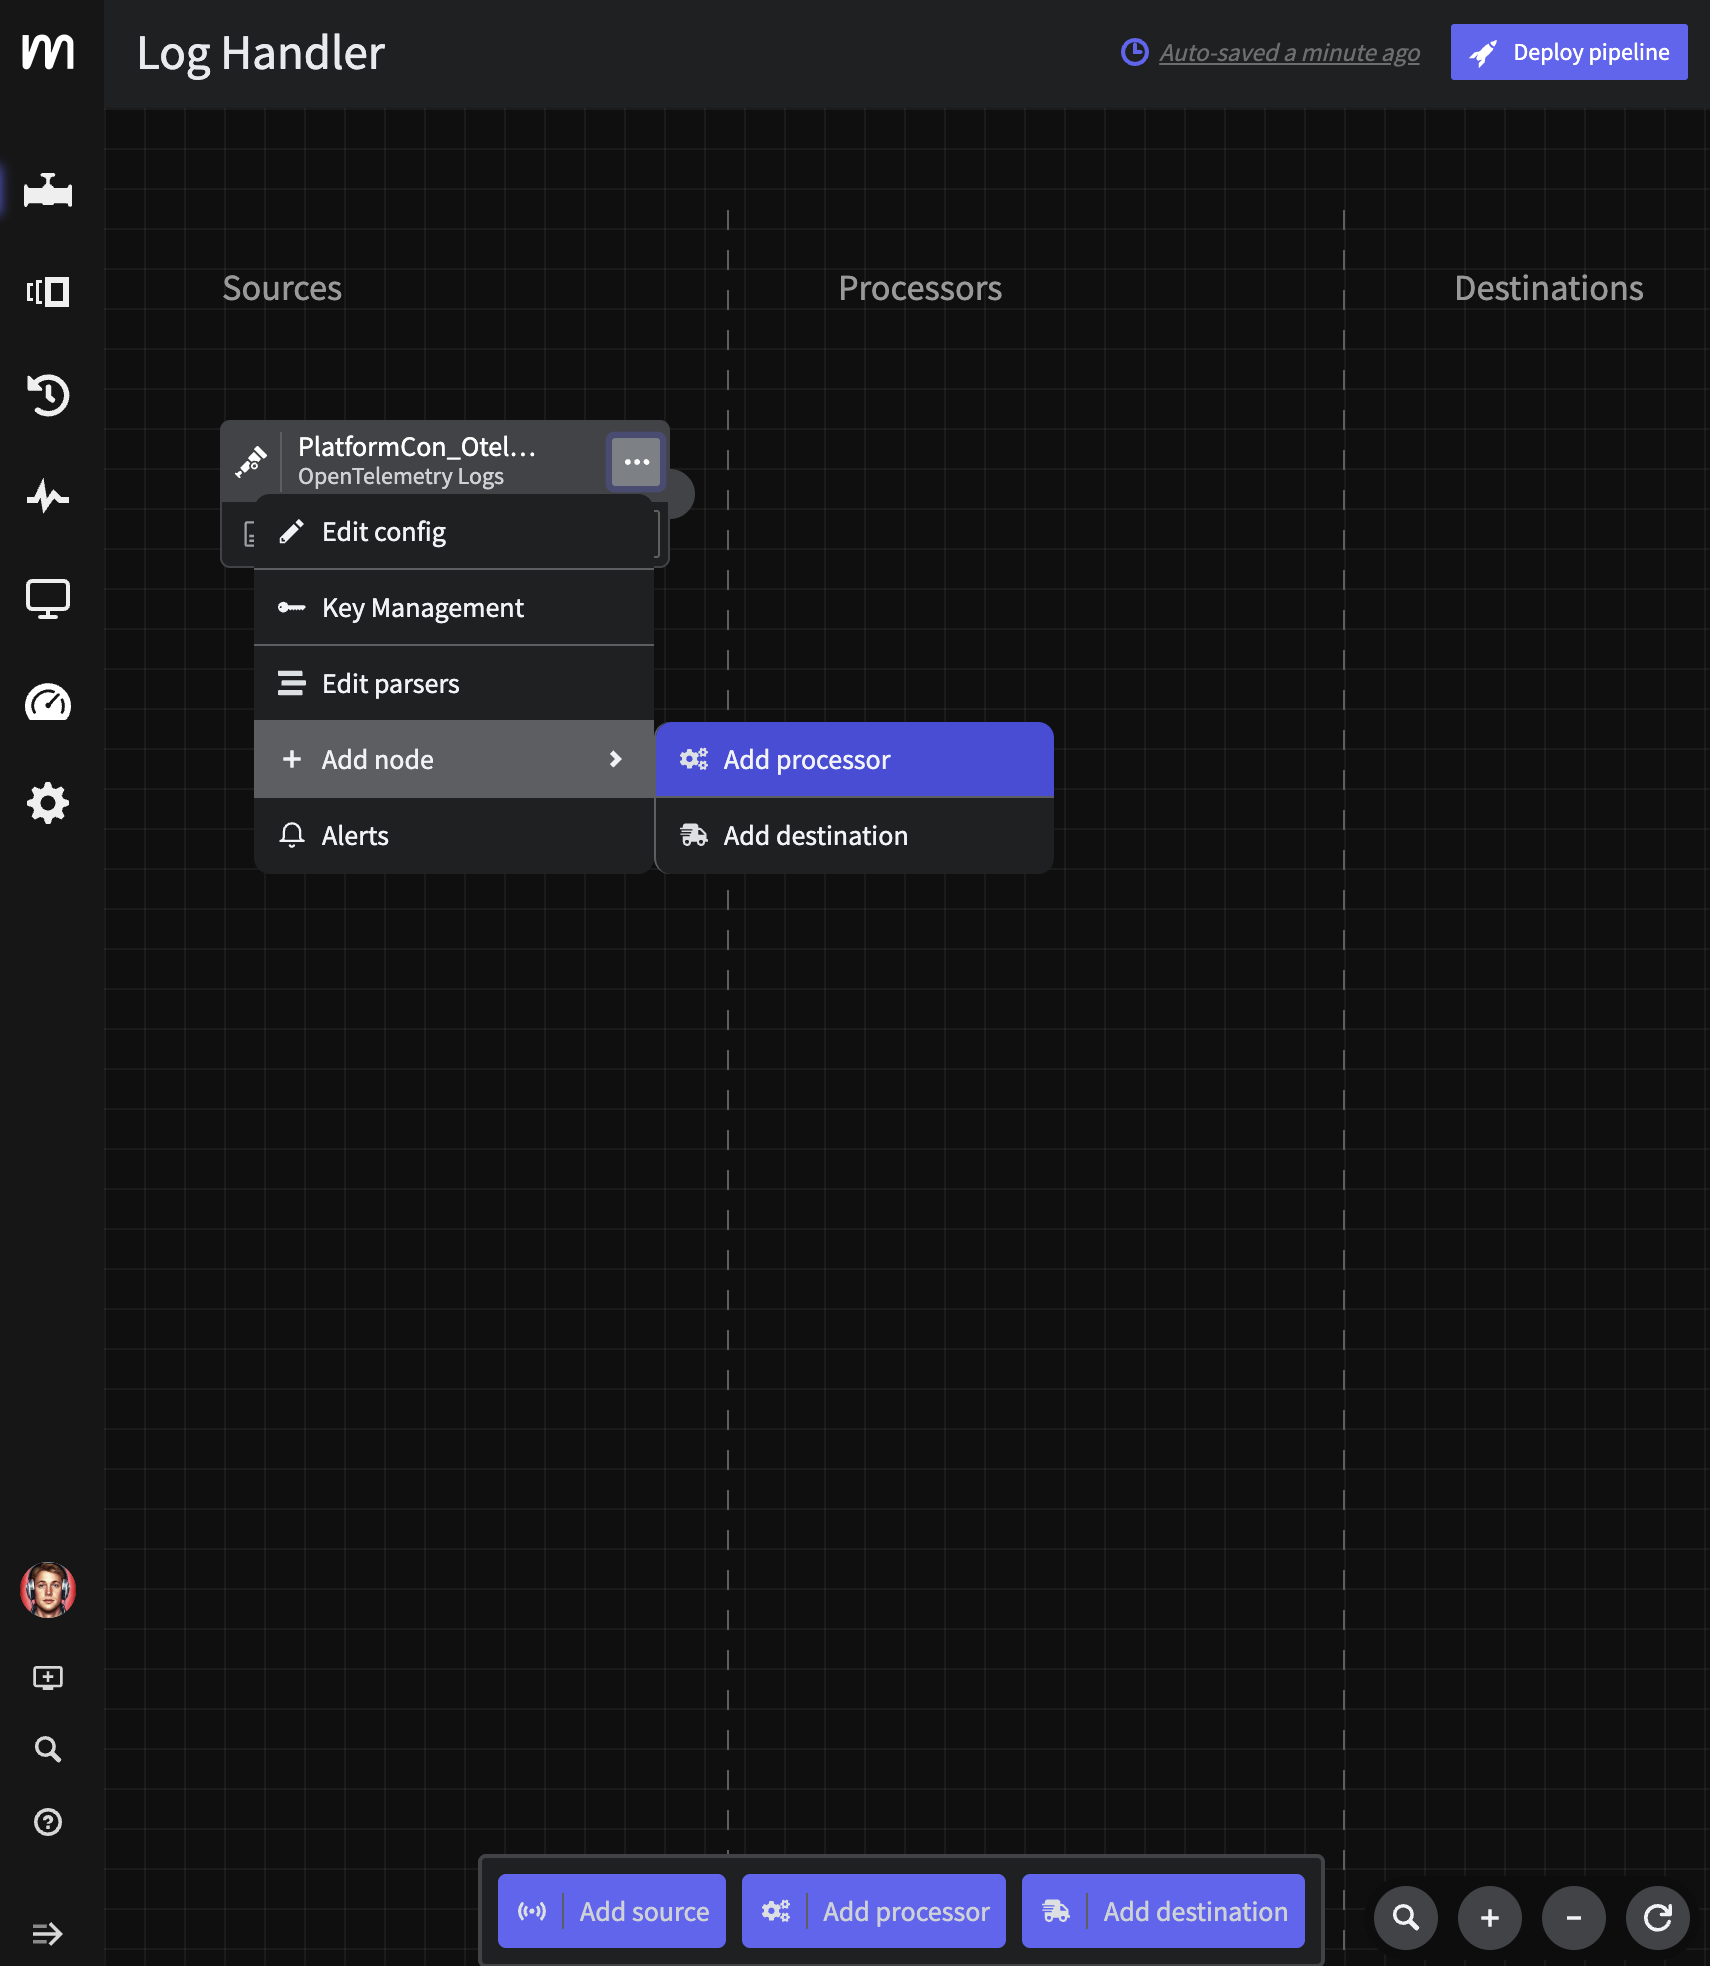
In order to take advantage of Responsive Pipelines, we need to enrich each event with the current pipelines operational state. The easiest way to do this is by adding an enrichment script right off the bat. Click thethree dots on your Otel Log Source and select Add Node->Add Processor->Script Execution.
 Paste in the following Javascript and click
 Save. Note that the script does a bit more than add the operational_state state variable, we are also normalizing some of this Otel data to be easier to use in Mezmo Log Analysis.
Step 4: Parse Custom Apache Logs
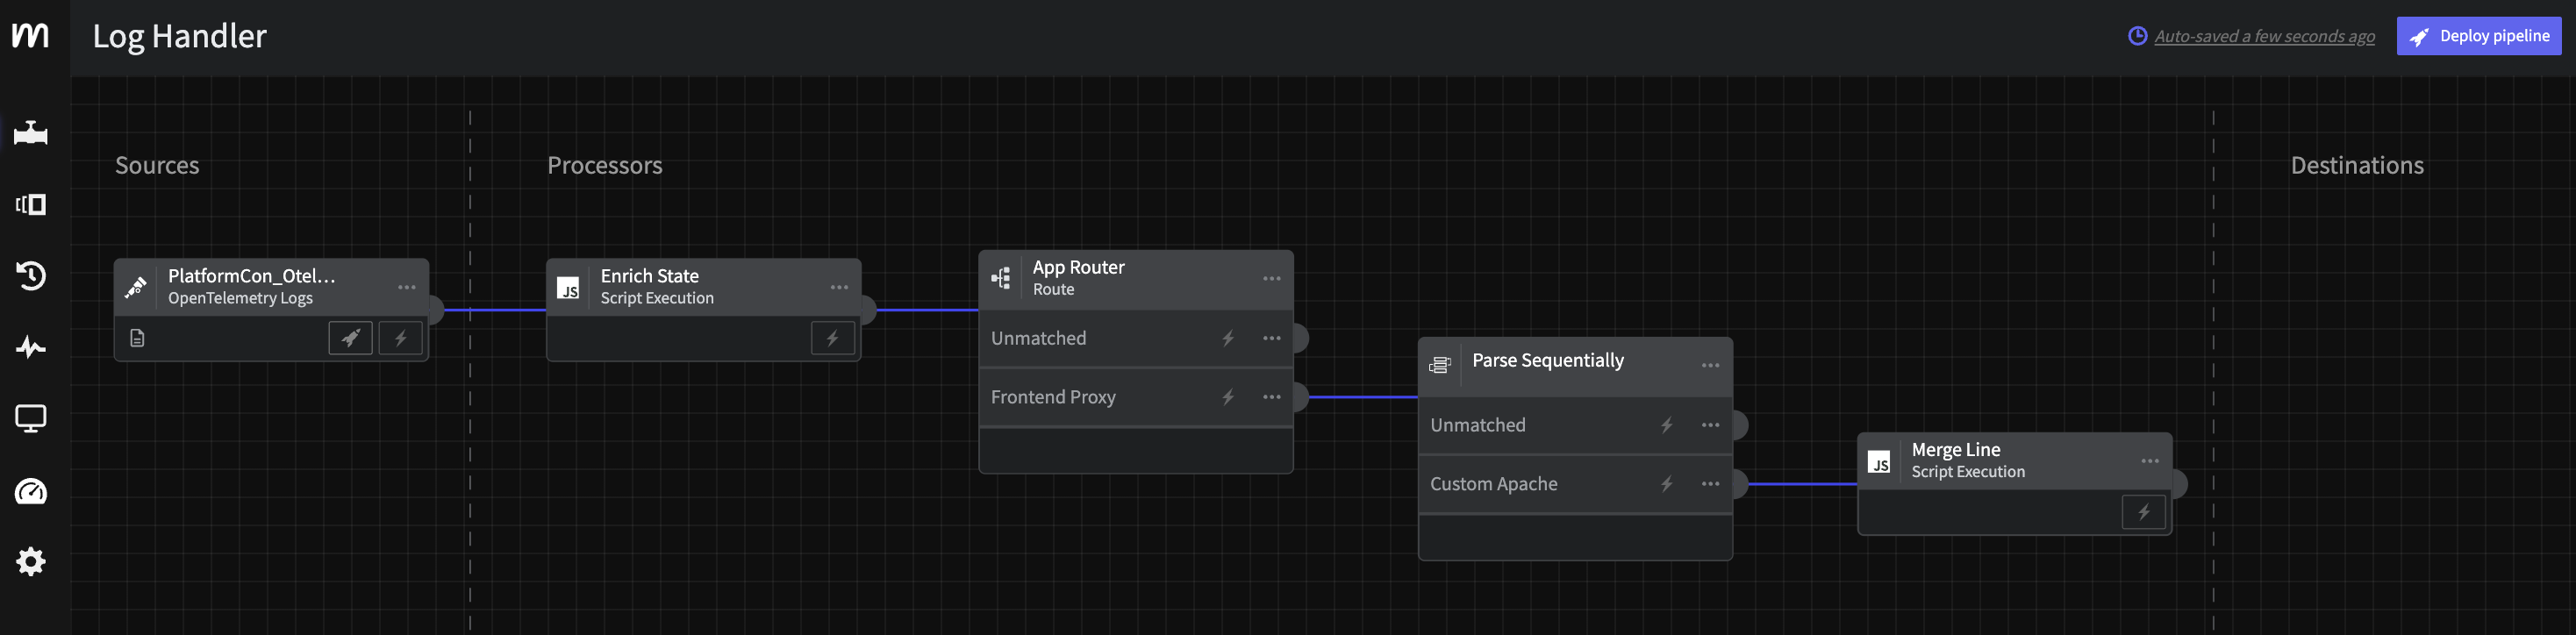
As noted in the prior section, the raw Apache data coming in fromfrontend-proxy is an unparsed, custom format defined by the OpenTelemetry demo. To ensure teams can take full advantage, we will parse this data with a Grok parser so that it is structured and easily searchable.
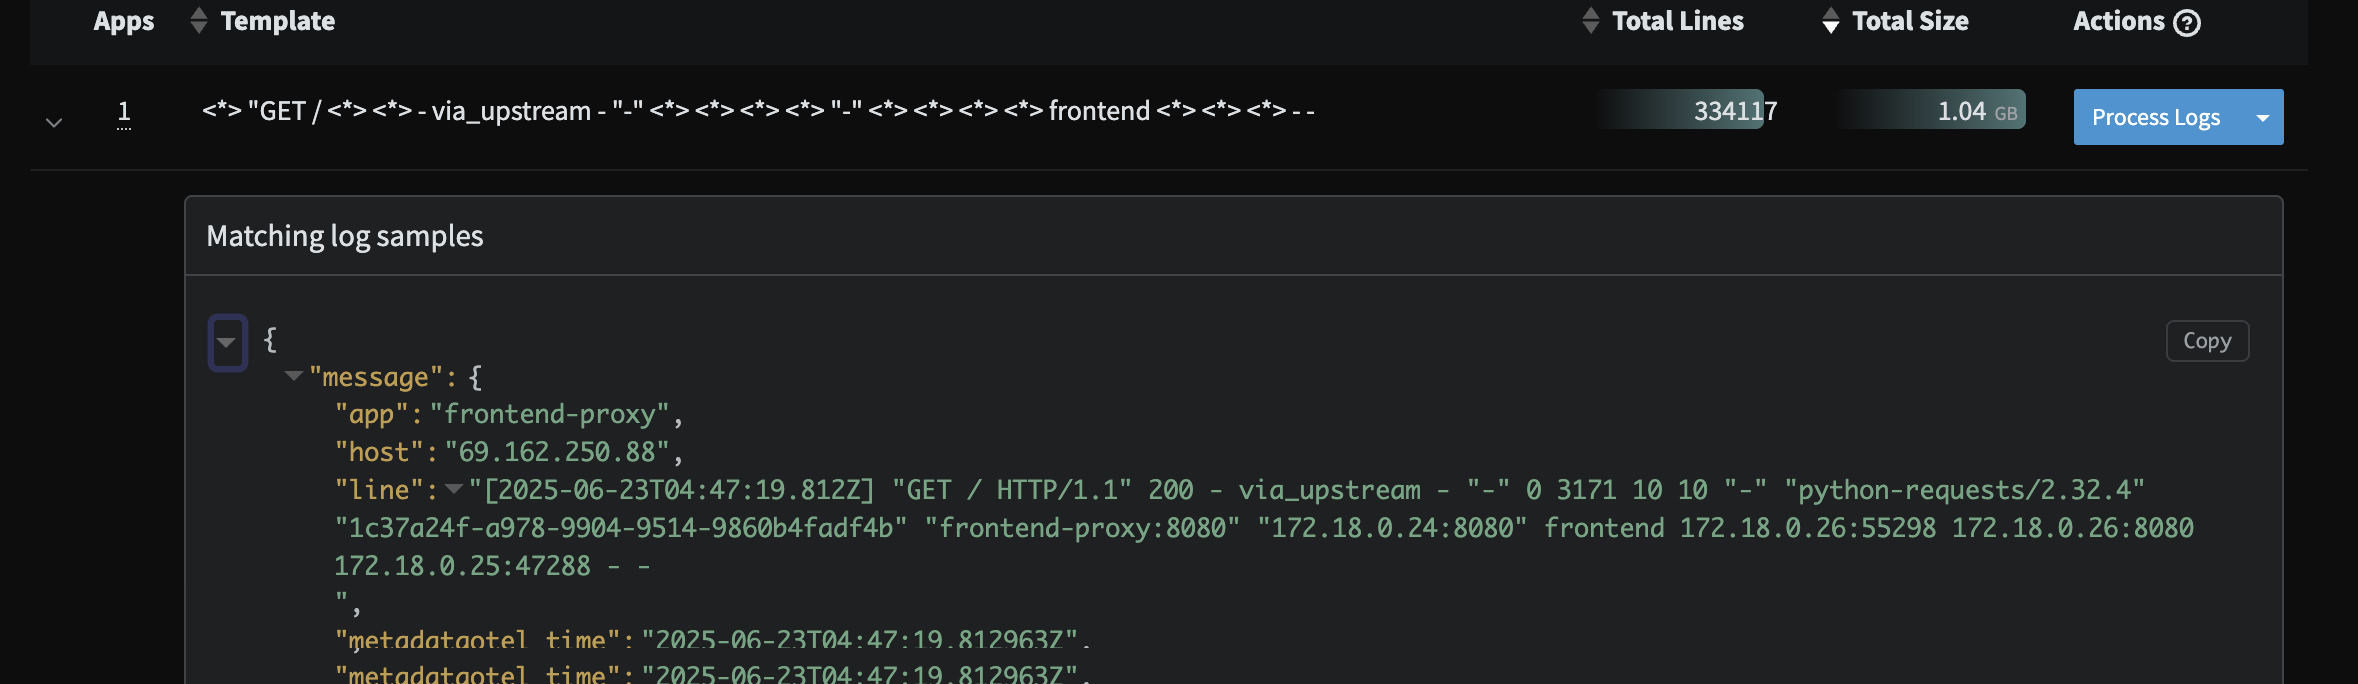 To do this, we will add another
 Route Processor by App along with a Parse Sequentially processor on that slice of data.
Step 4.a: App Router
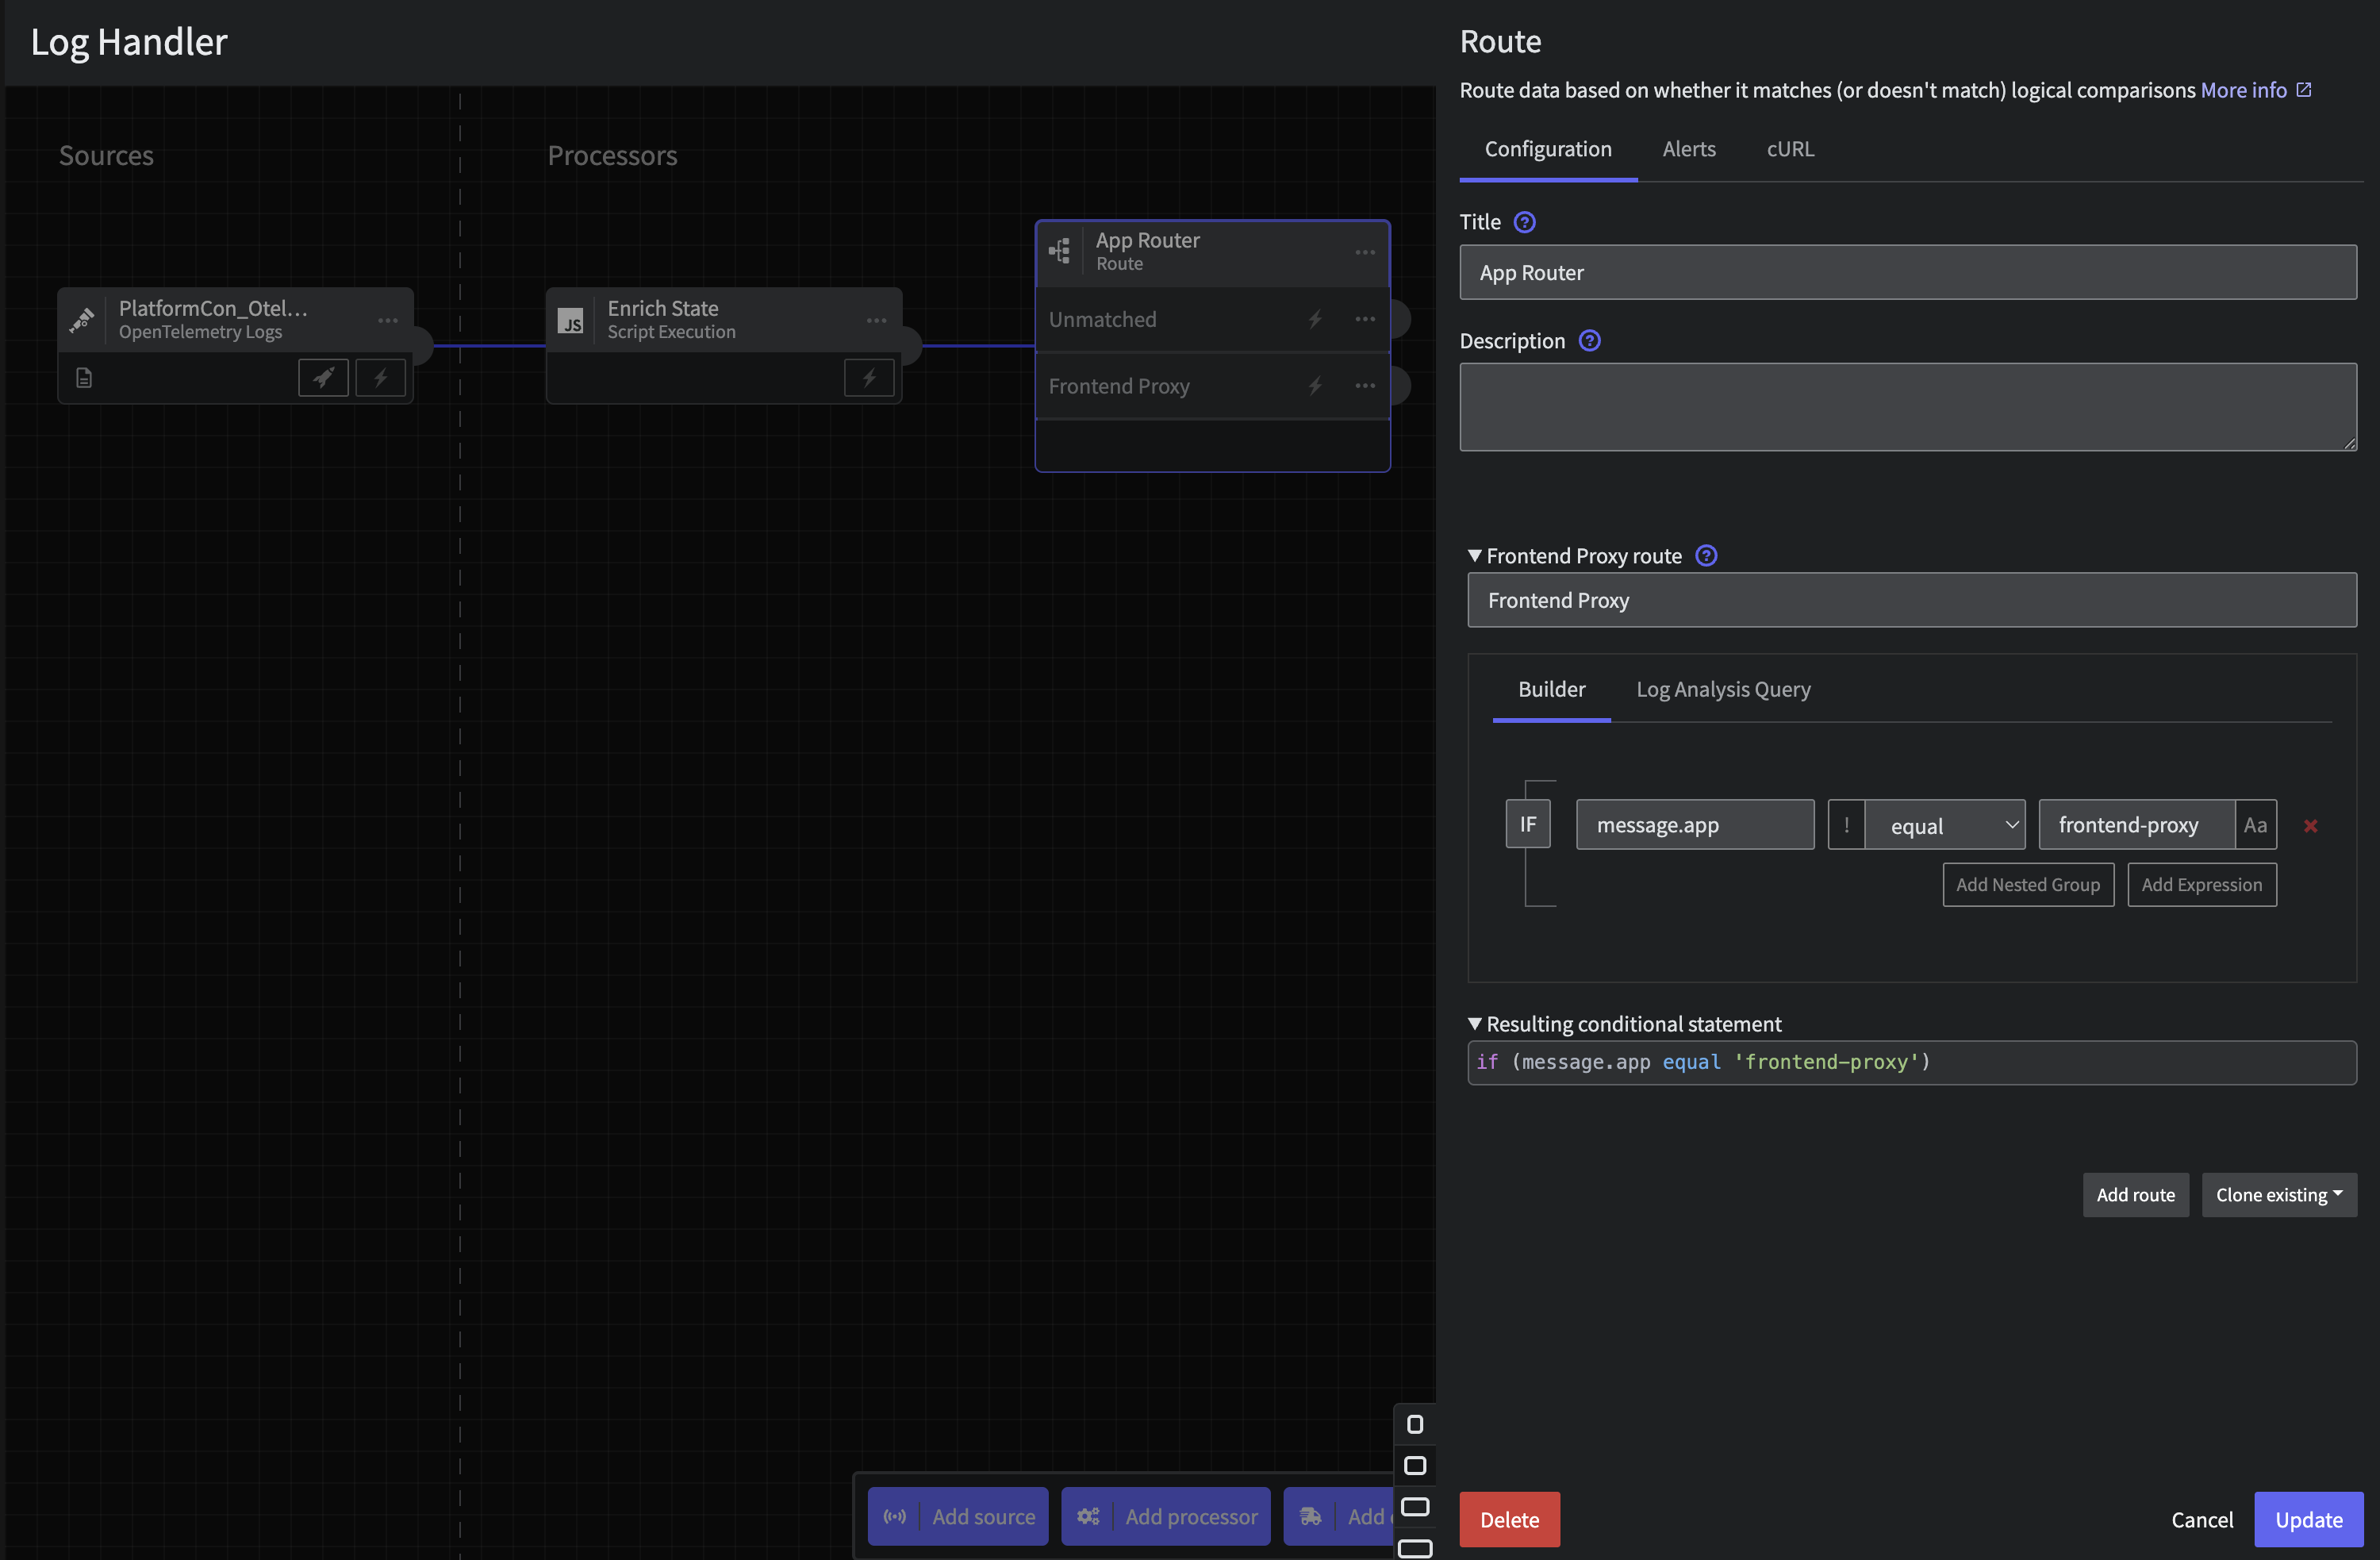
Connect a Route processor through thethree dots or Add Processor at the bottom with the following configuration on application
- Title:
App Router - Route:
- Title:
Frontend Proxy - Criteria:
message.appequalfrontend-proxy
Step 4.b: Parse Sequentially Processor
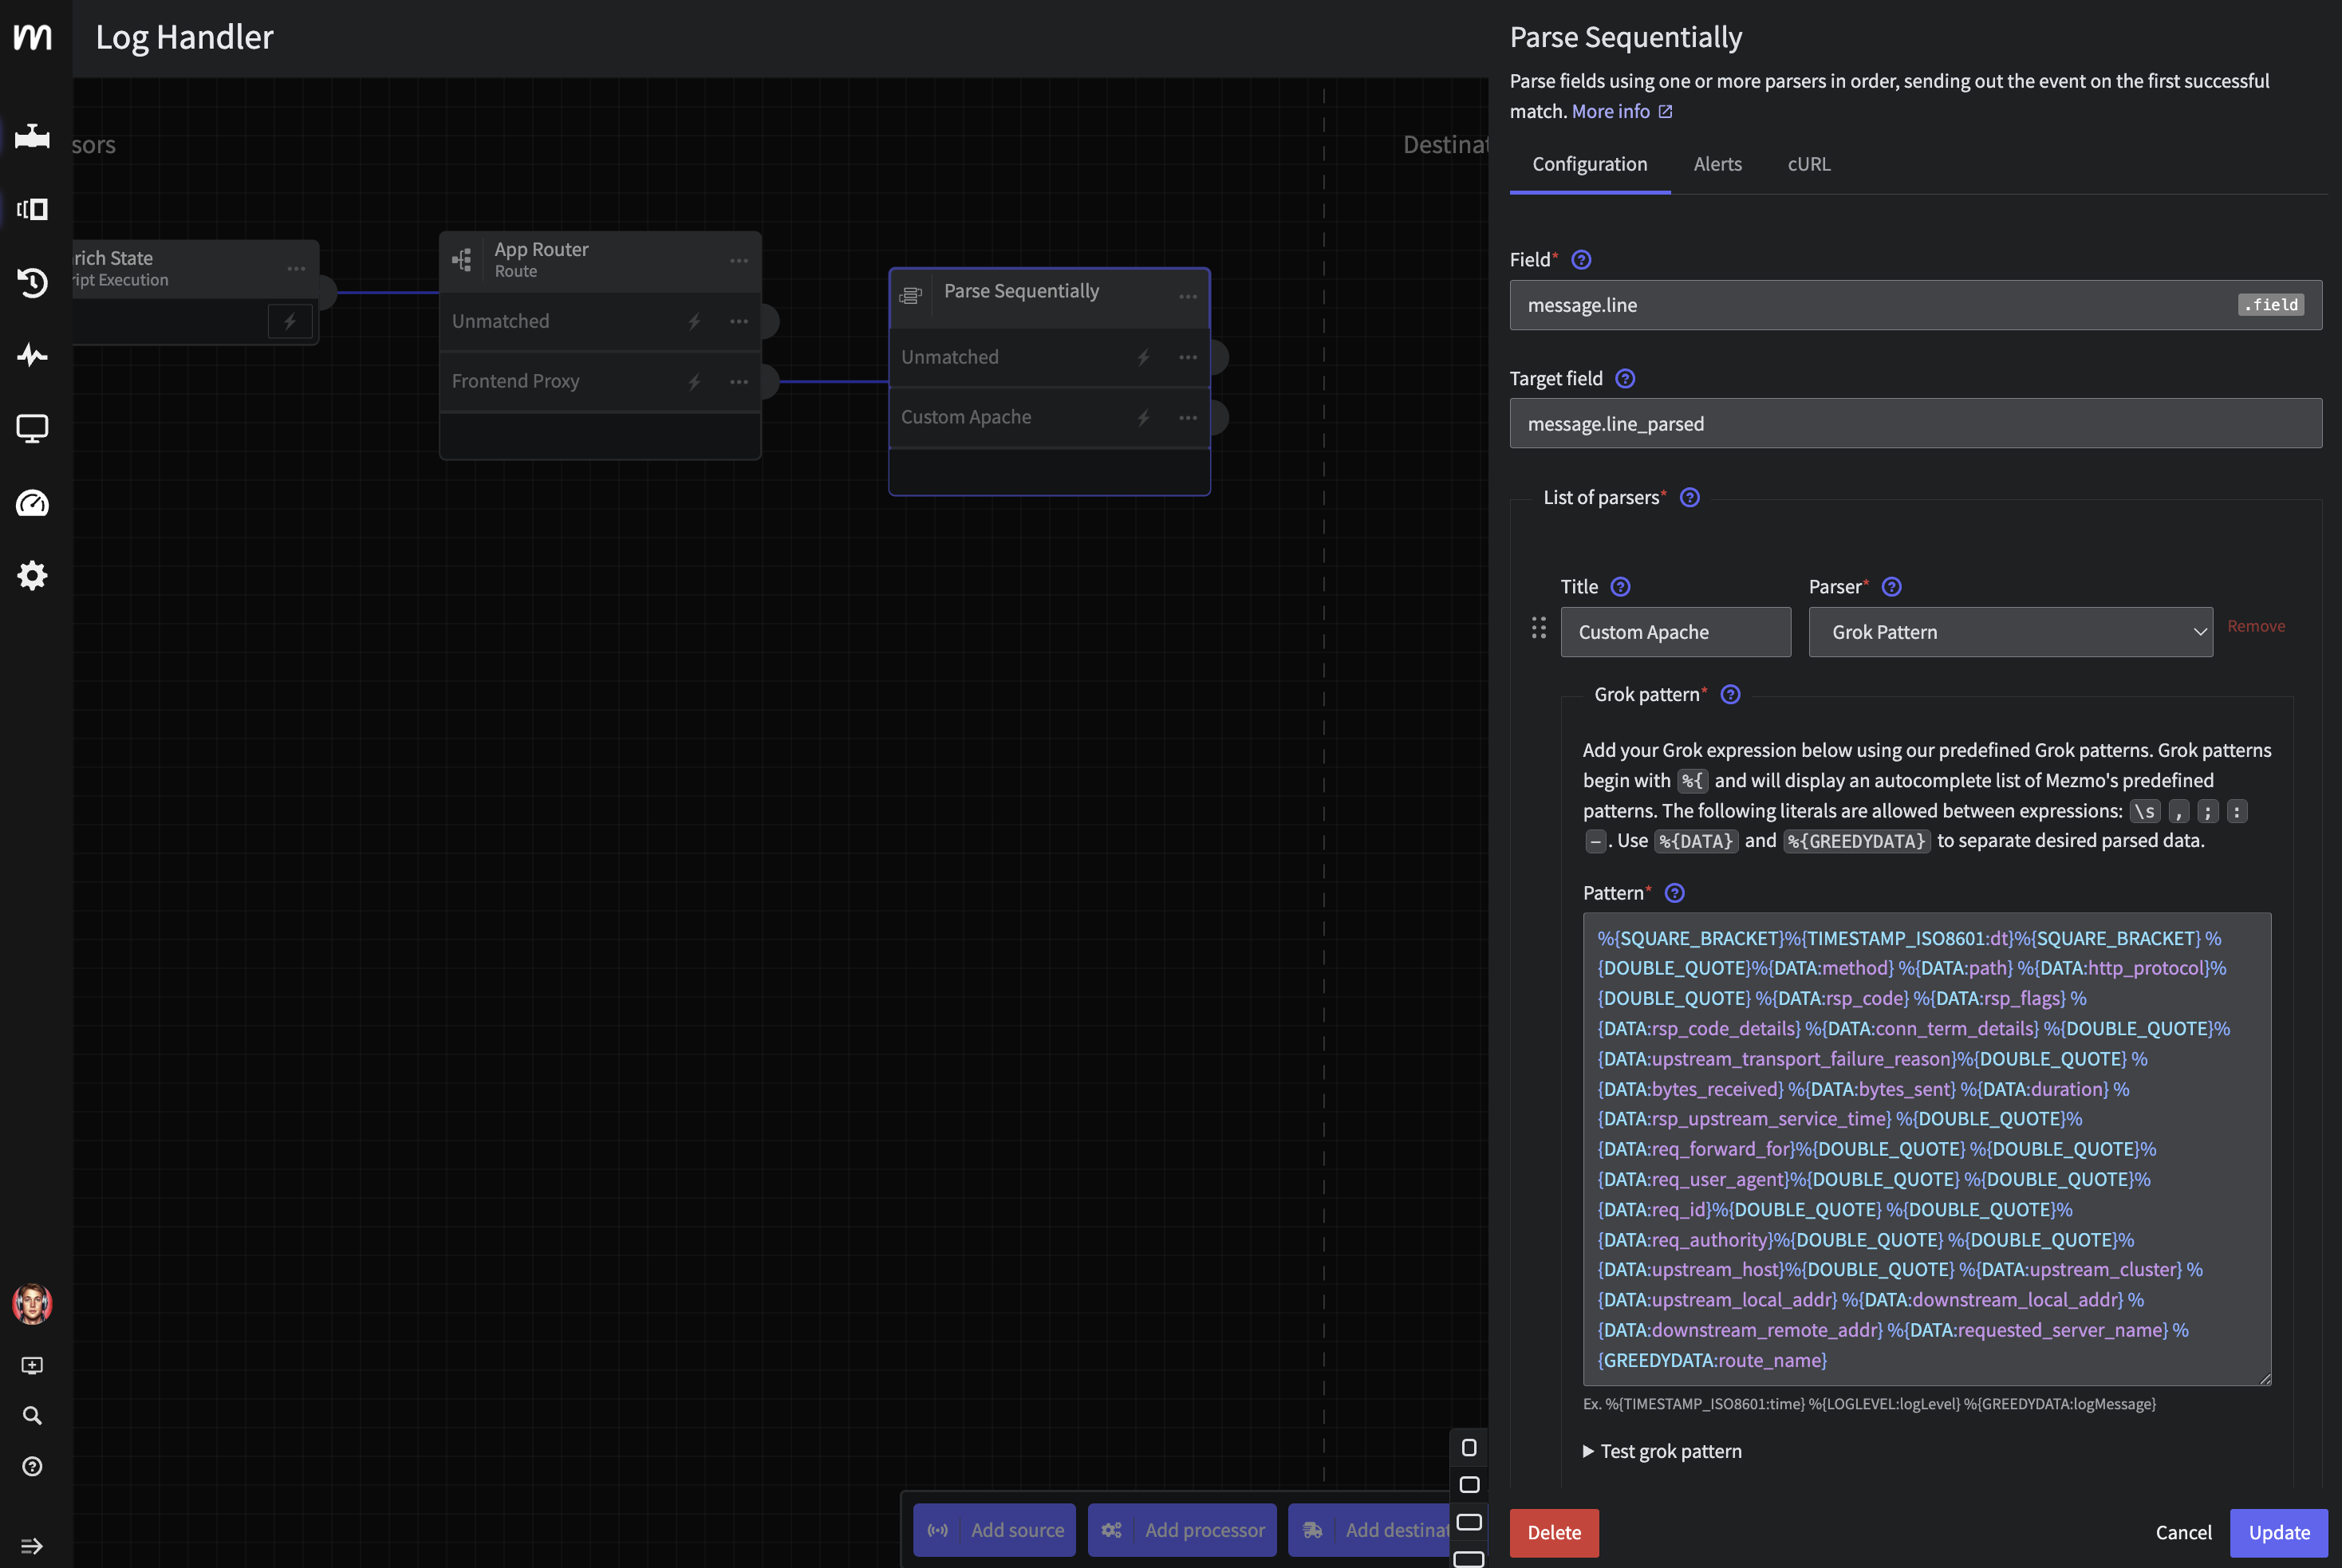
Now let’s wire aParse Sequentially processor to the Frontend Proxy output. We will use the following configuration
- Field:
message.line - Target field:
message.line_parsed - Custom Parser:
- Title:
Custom Apache - Parser:
Grok Pattern - Pattern:
%{SQUARE_BRACKET}%{TIMESTAMP_ISO8601:dt}%{SQUARE_BRACKET} %{DOUBLE_QUOTE}%{DATA:method} %{DATA:path} %{DATA:http_protocol}%{DOUBLE_QUOTE} %{DATA:rsp_code} %{DATA:rsp_flags} %{DATA:rsp_code_details} %{DATA:conn_term_details} %{DOUBLE_QUOTE}%{DATA:upstream_transport_failure_reason}%{DOUBLE_QUOTE} %{DATA:bytes_received} %{DATA:bytes_sent} %{DATA:duration} %{DATA:rsp_upstream_service_time} %{DOUBLE_QUOTE}%{DATA:req_forward_for}%{DOUBLE_QUOTE} %{DOUBLE_QUOTE}%{DATA:req_user_agent}%{DOUBLE_QUOTE} %{DOUBLE_QUOTE}%{DATA:req_id}%{DOUBLE_QUOTE} %{DOUBLE_QUOTE}%{DATA:req_authority}%{DOUBLE_QUOTE} %{DOUBLE_QUOTE}%{DATA:upstream_host}%{DOUBLE_QUOTE} %{DATA:upstream_cluster} %{DATA:upstream_local_addr} %{DATA:downstream_local_addr} %{DATA:downstream_remote_addr} %{DATA:requested_server_name} %{GREEDYDATA:route_name}
 Finally, let’s keep the original line with a quick Scirpt, add a
 Script Execution processor connected to the Parse Sequentially: Apache output containing the following script:
Step 5: Route Based on State
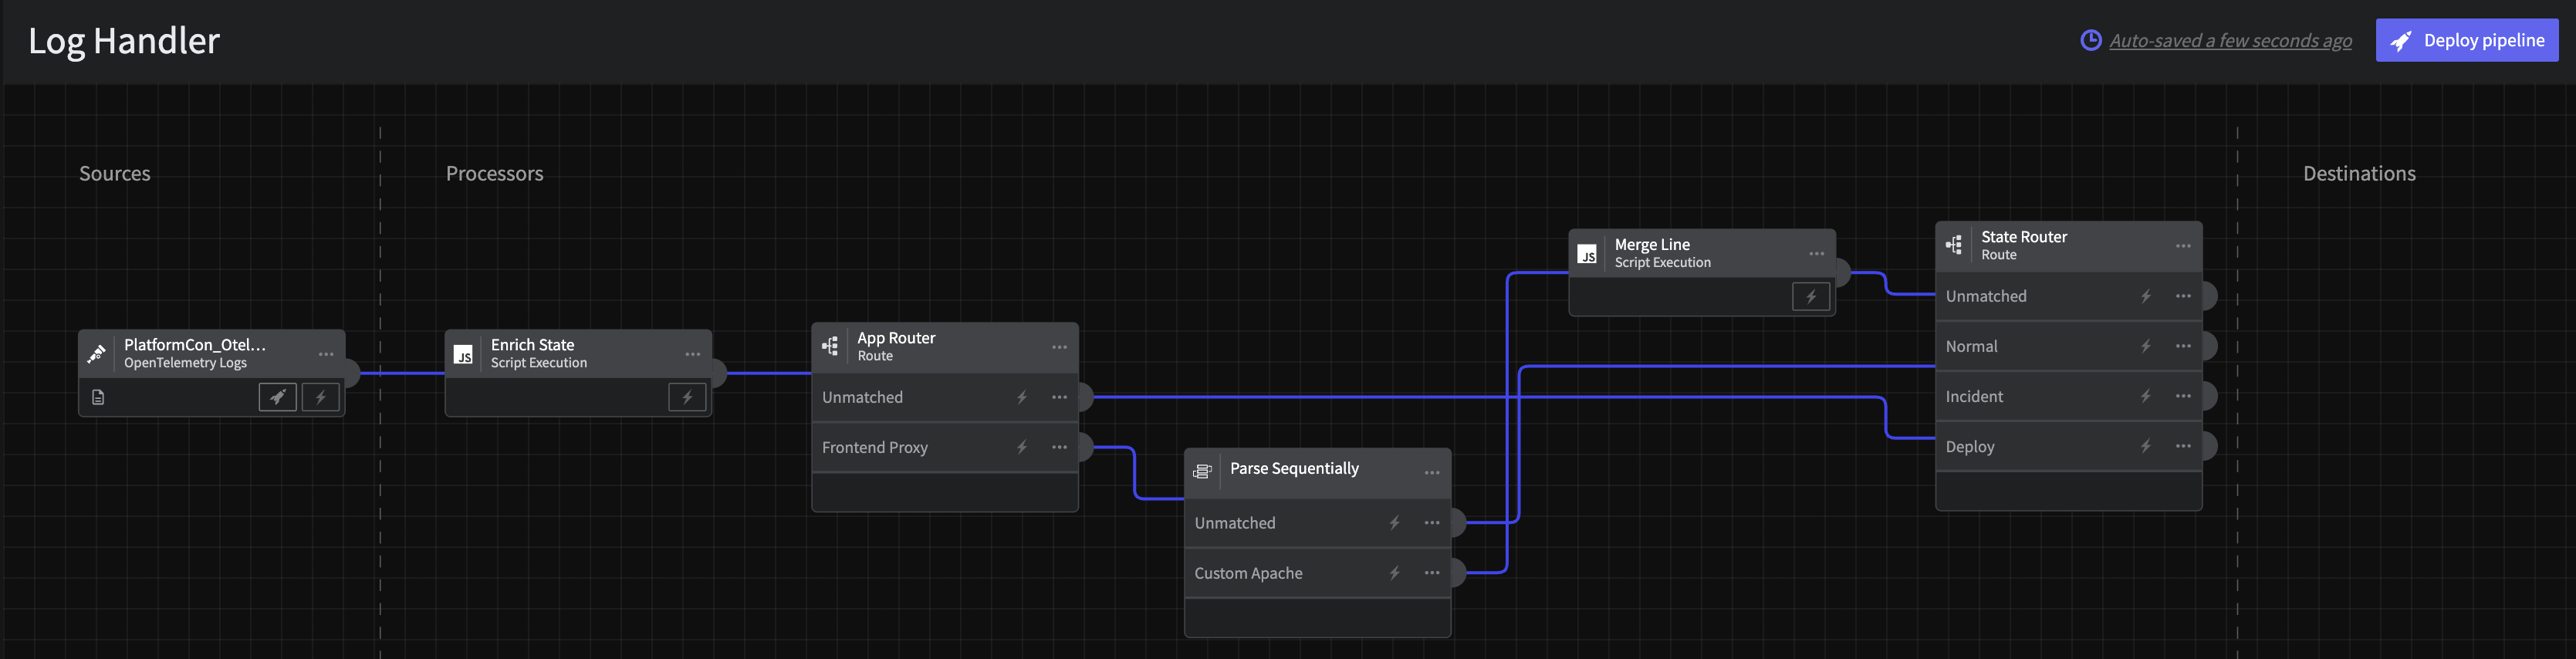
After the initial Enrichment processor and Apache Parser, let’s now route the data flow based on Pipelines state, ie thatoperational_state. Connect a Route processor to all prior outputs with the following configuration
-
Title:
State Router -
Route 1:
- Title:
Normal - Criteria:
message.op_statecontainsnormal
- Title:
-
Route 2:
- Title:
Incident - Criteria:
message.op_statecontainsincident
- Title:
-
Route 3:
- Title:
Deploy - Criteria:
message.op_statecontainsdeploy
- Title:
 You will end up with a pipeline that looks like the following
Step 6: Aggregate Normal State Logs
Now, lets optimize those noisy homepage flooding logs using aReduce processor. Effectively this will let us count and aggregate mainy logs into one easy to watch signal. A common pattern is to turn this into a metric but today we will leave this as a log for the downstream tool.
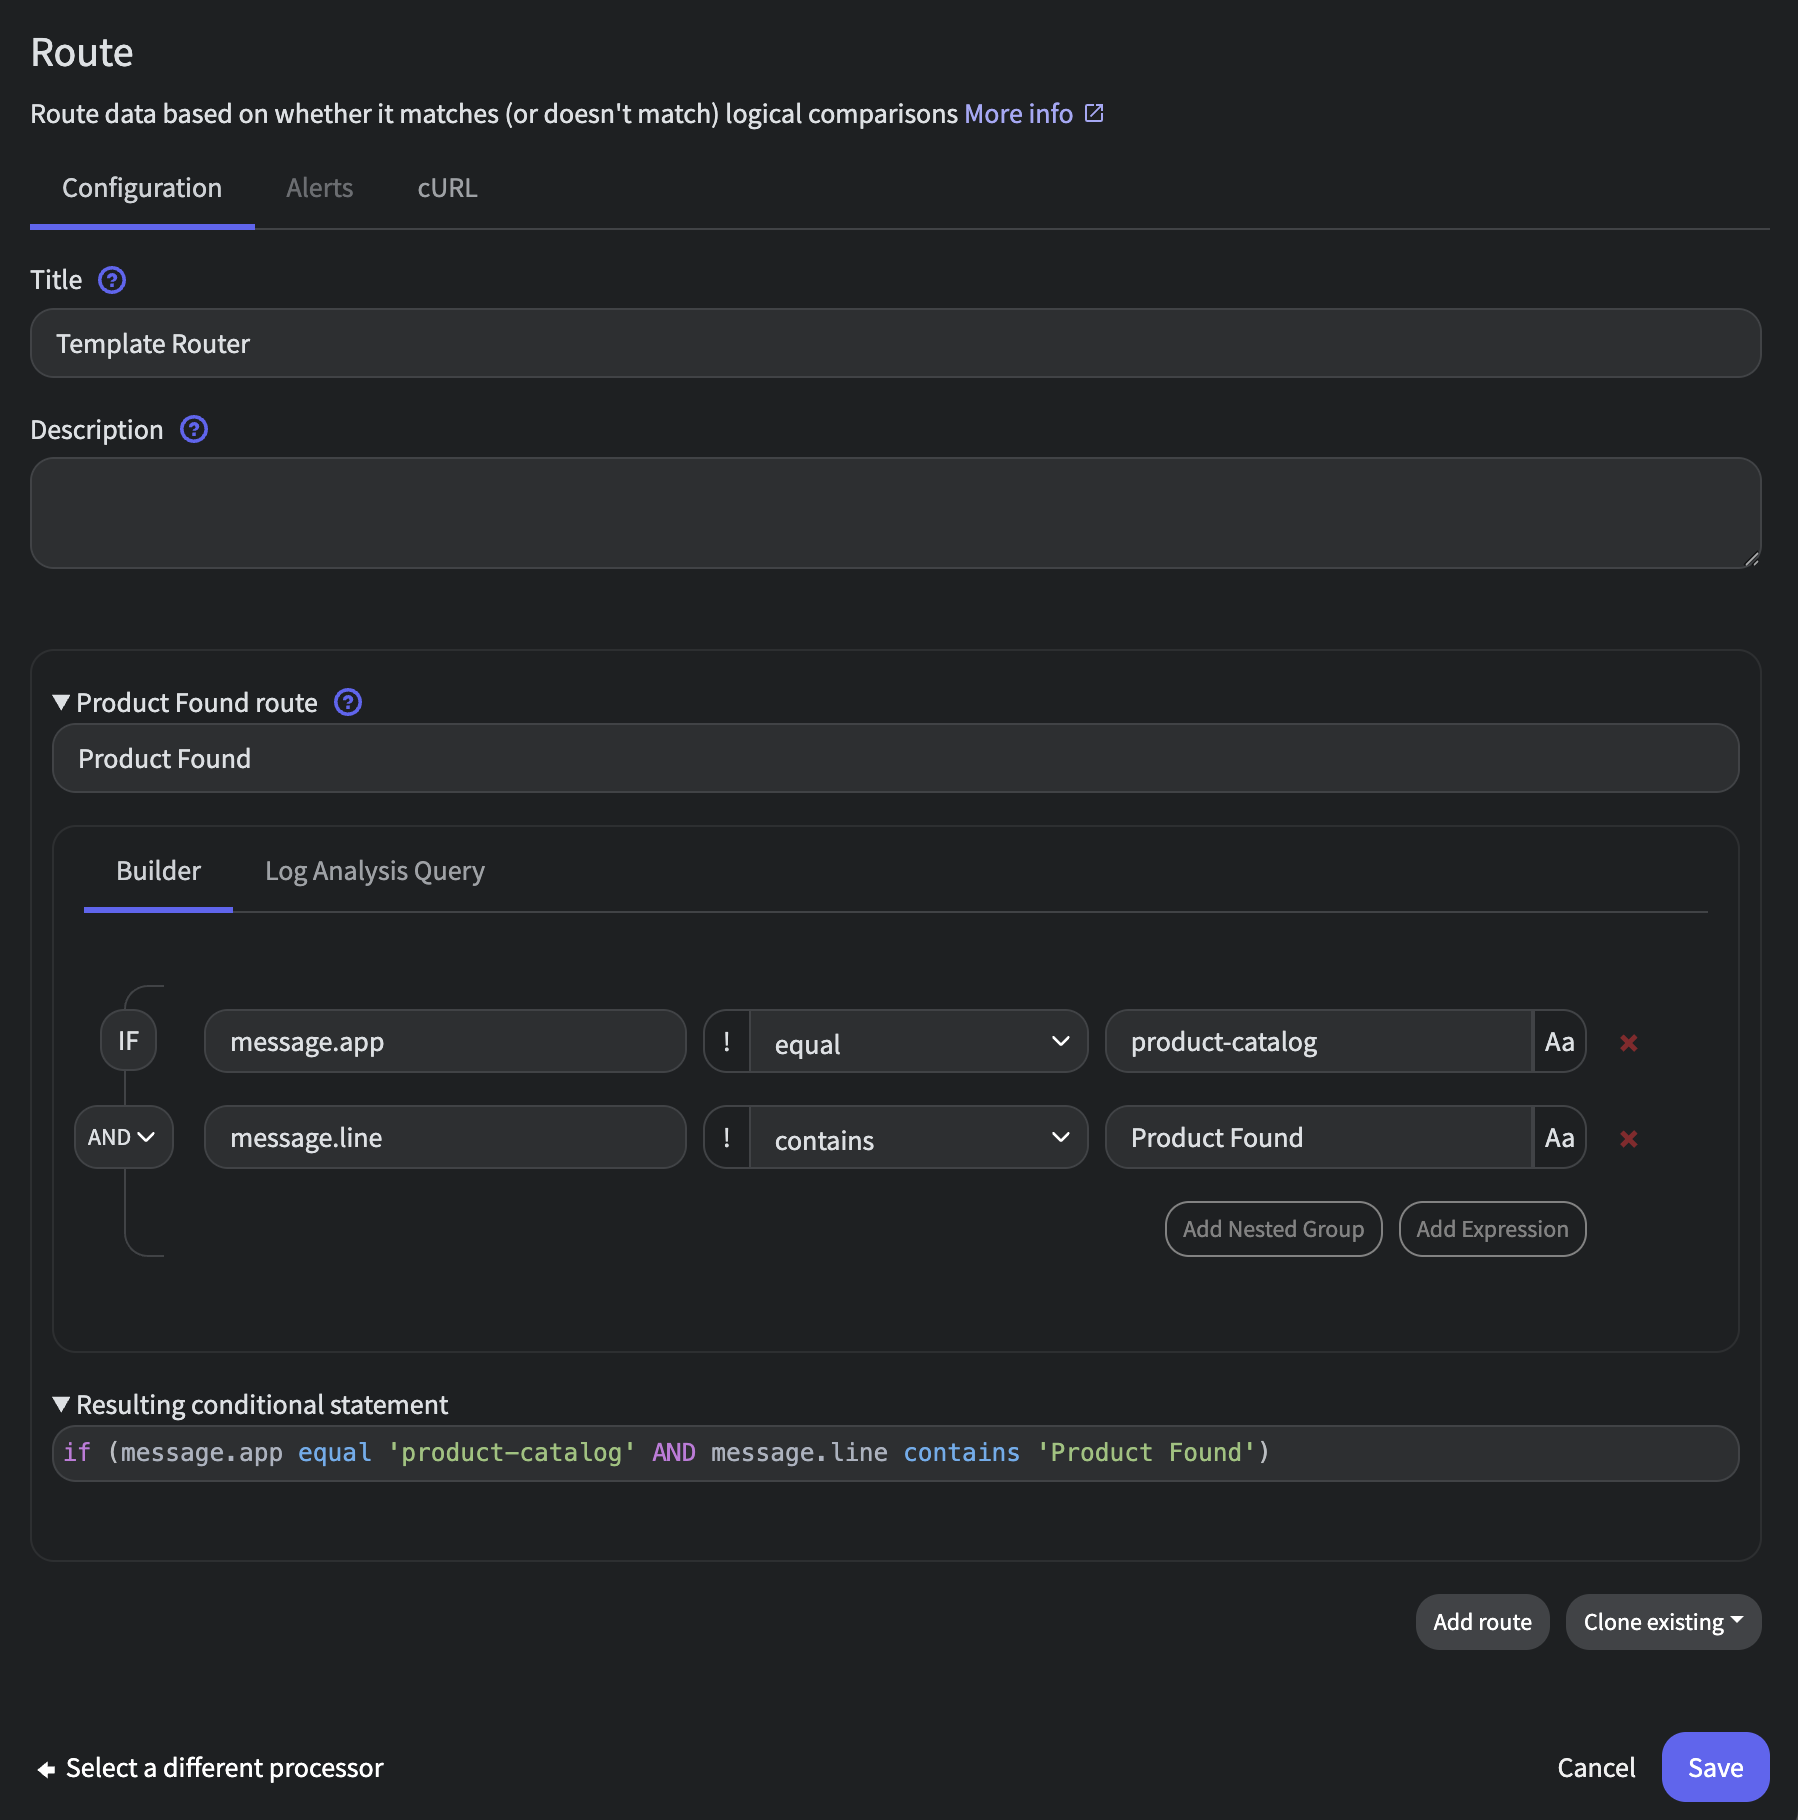
To accomplish this, create a new Route processor connected to State Router’s Normal and Unmatched outputs with the following configuration:
- Title:
Template Router - Route 1:
- Title:
Product Found - Criteria:
(message.app equal product-catalog) AND (message.line contains Product Found)
- Title:
 We will then add a
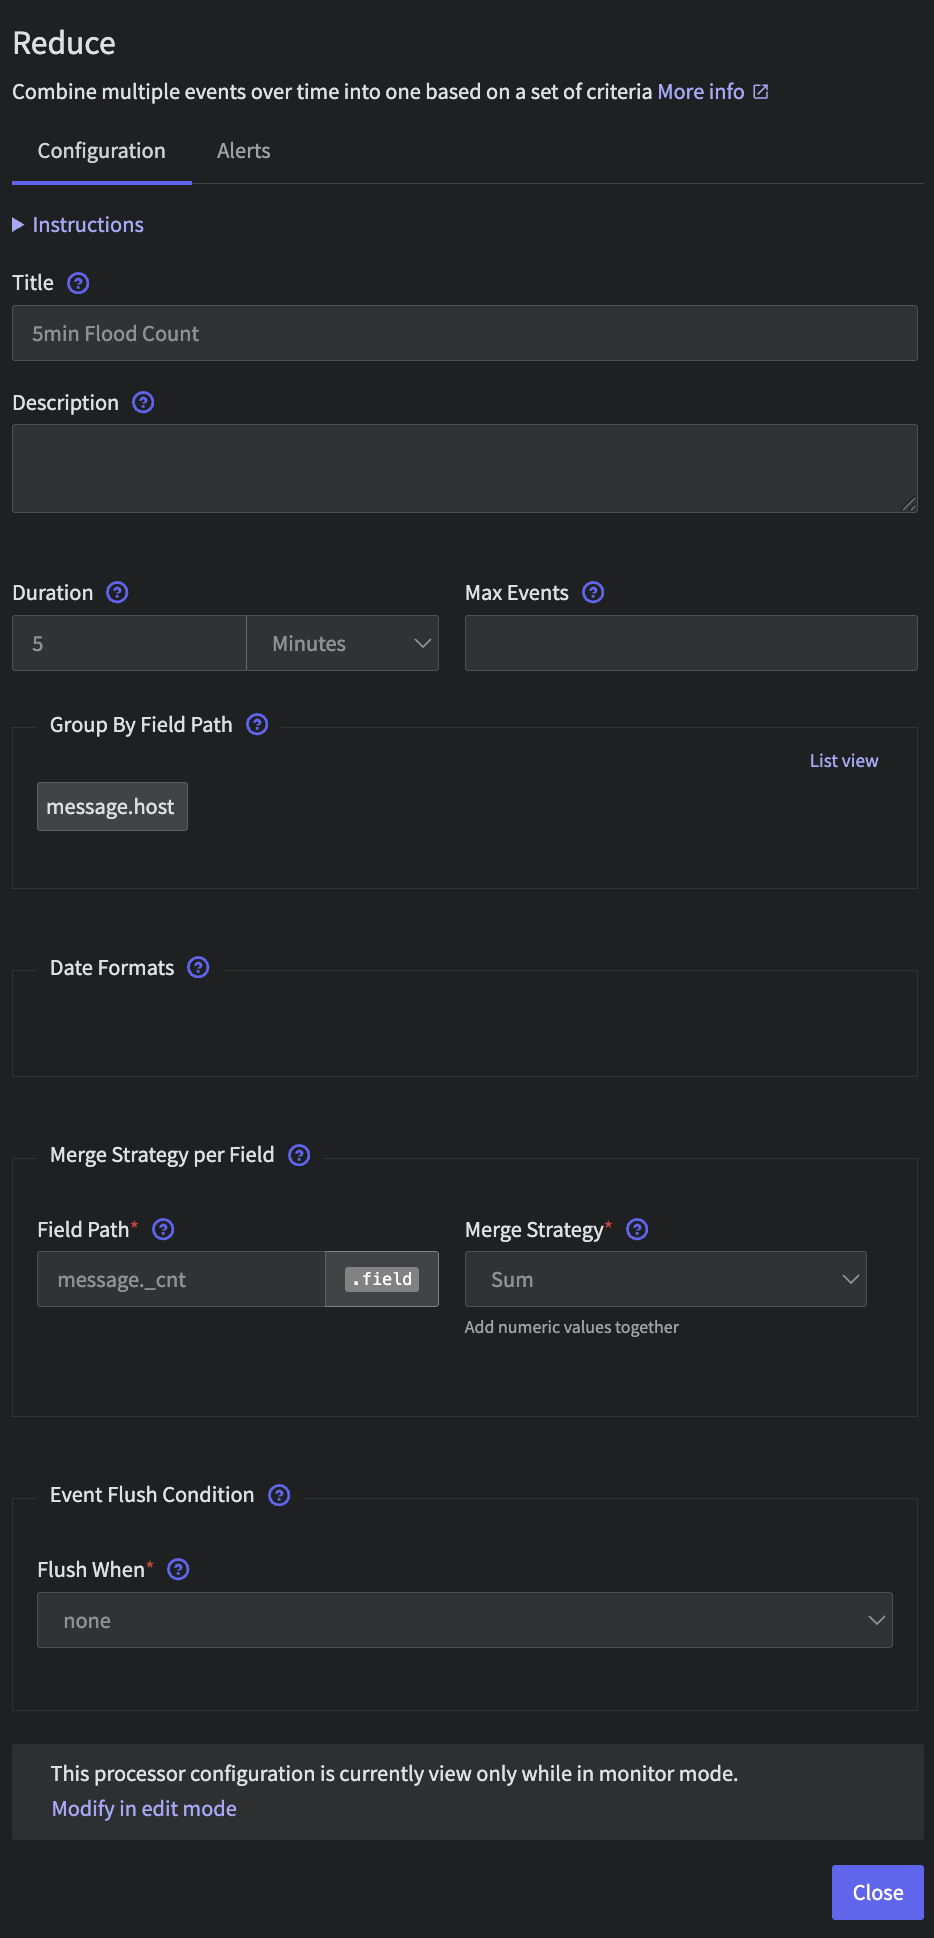
 Reduce processor to roll these logs up over 5 minutes. Connect the processor with the following configuration
- Title:
5min Count - Duration:
5 minutes - Group By Field Path:
message.host - Merge Strategy per Field:
- Field Path:
message._cntsum
 Finally, we will convert the output into a summary message using the following configuration

Step 7: Sample Normal State Logs
FromTemplate Router: Unmatached let’s add sample 1 out of every 10 while in Normal state Simply connect a Sample processor with the following configuration:
- Rate:
1/10
Step 8: Wire to Mezmo Log Analysis
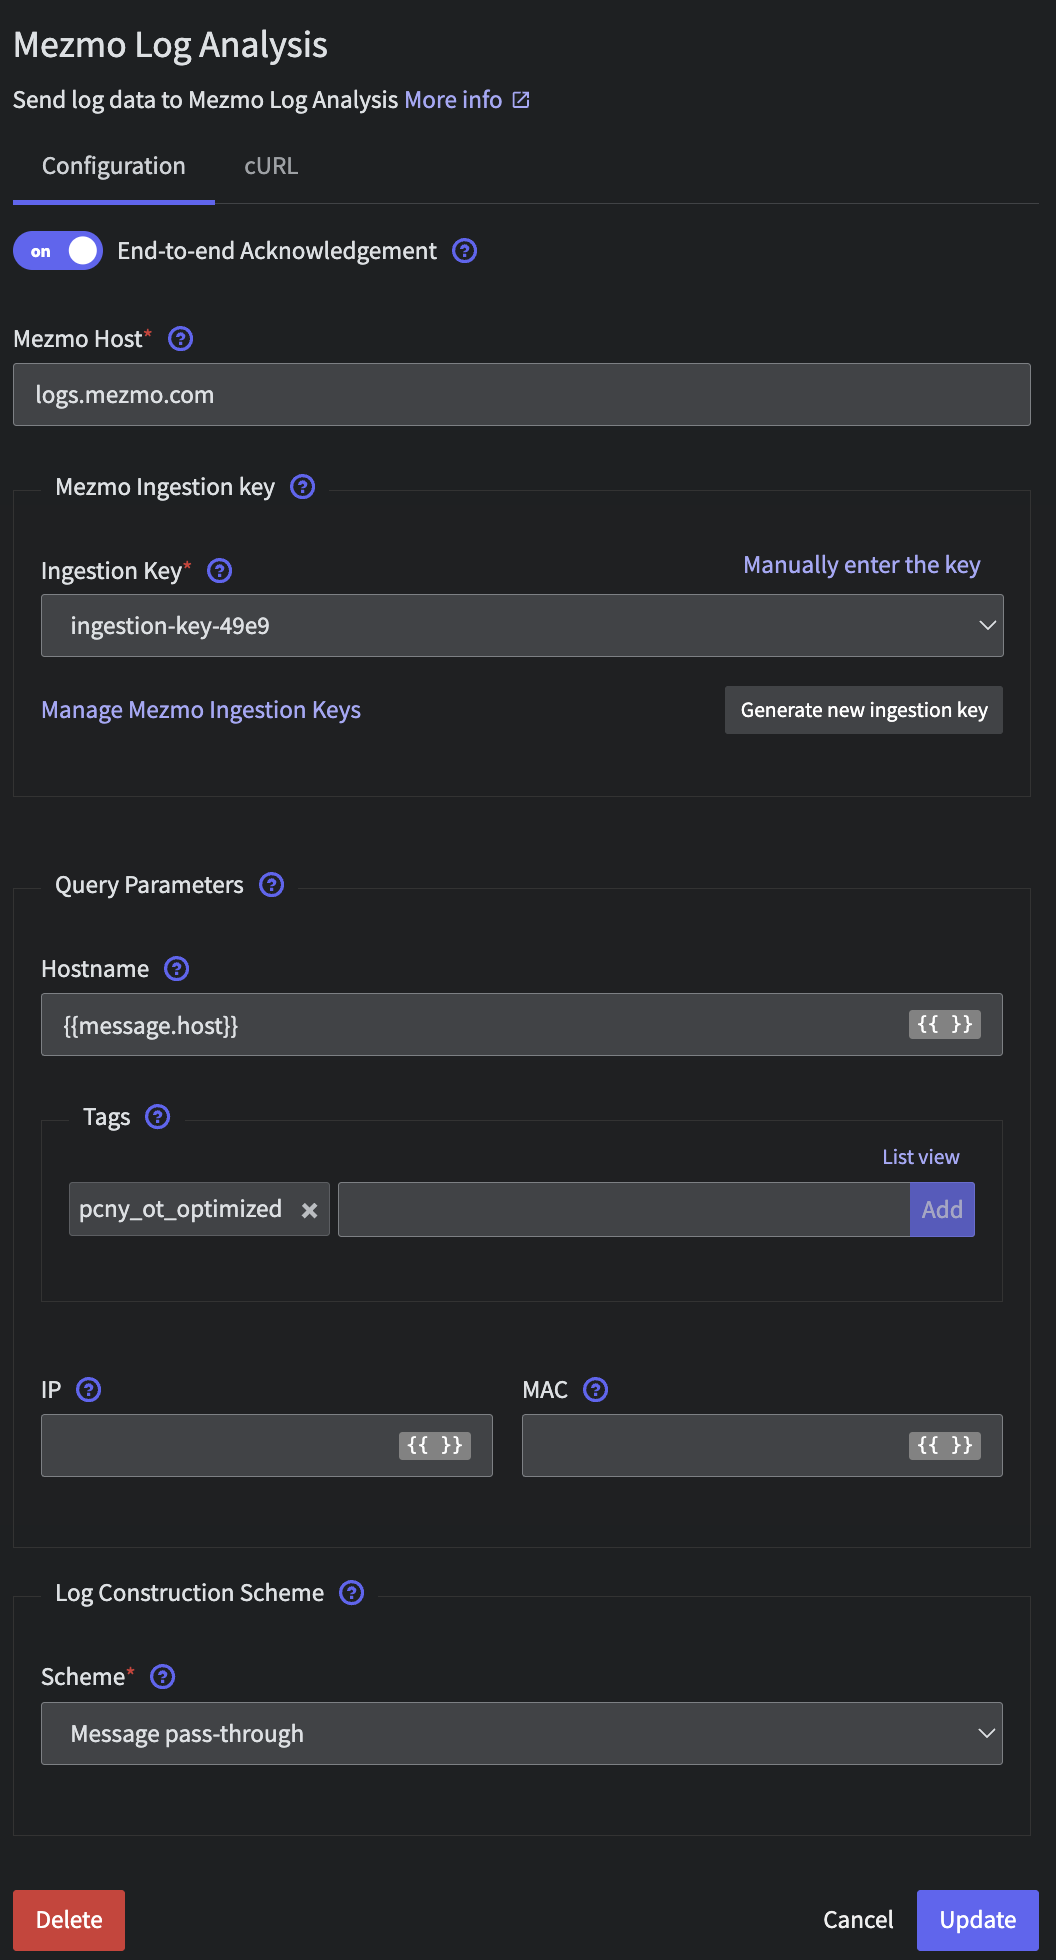
Finally, we will send all of this data into Mezmo Log Analysis. Because of our earlier work normalizing data in Step 3, we can simply add a final Destination to all nodes (including theIncident and Deploy paths). Create a Mezmo Log Analysis destination with the following configuration
- Ingestion key: generate or select
- Query Parameters:
- Hostname:
{{message.host}} - Tags:
otel-demo - Log Construction Scheme:
- Scheme:
Message pass-through
Step 9: Deploy
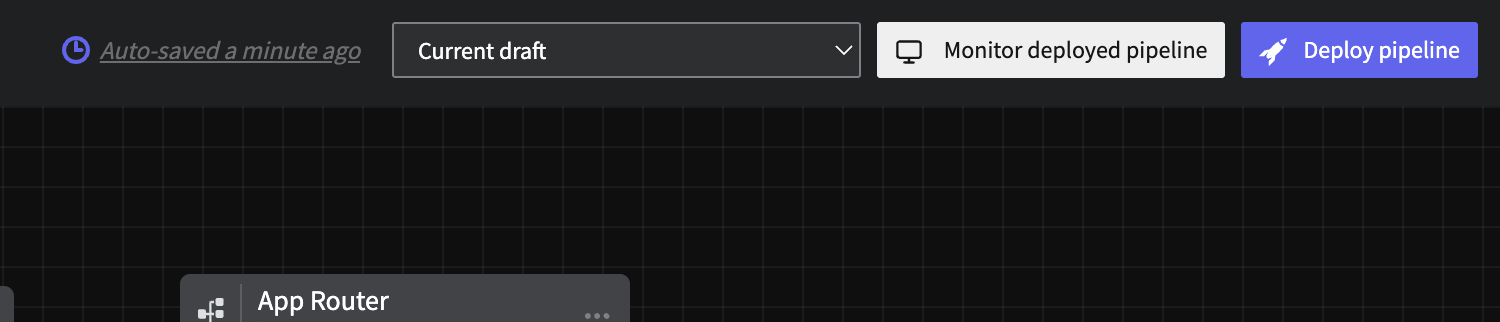
Next, we must deploy your pipeline in order to start optimizing that log data. To do this, selectDeploy in the top right of the UX
Step 10: Initiate State and Grab State ID
Our final step is to initiate and grab the state ID for the pipeline for automation and control later on. To do this, first we will enact a state by toggling the Normal mode to Incident mode and back.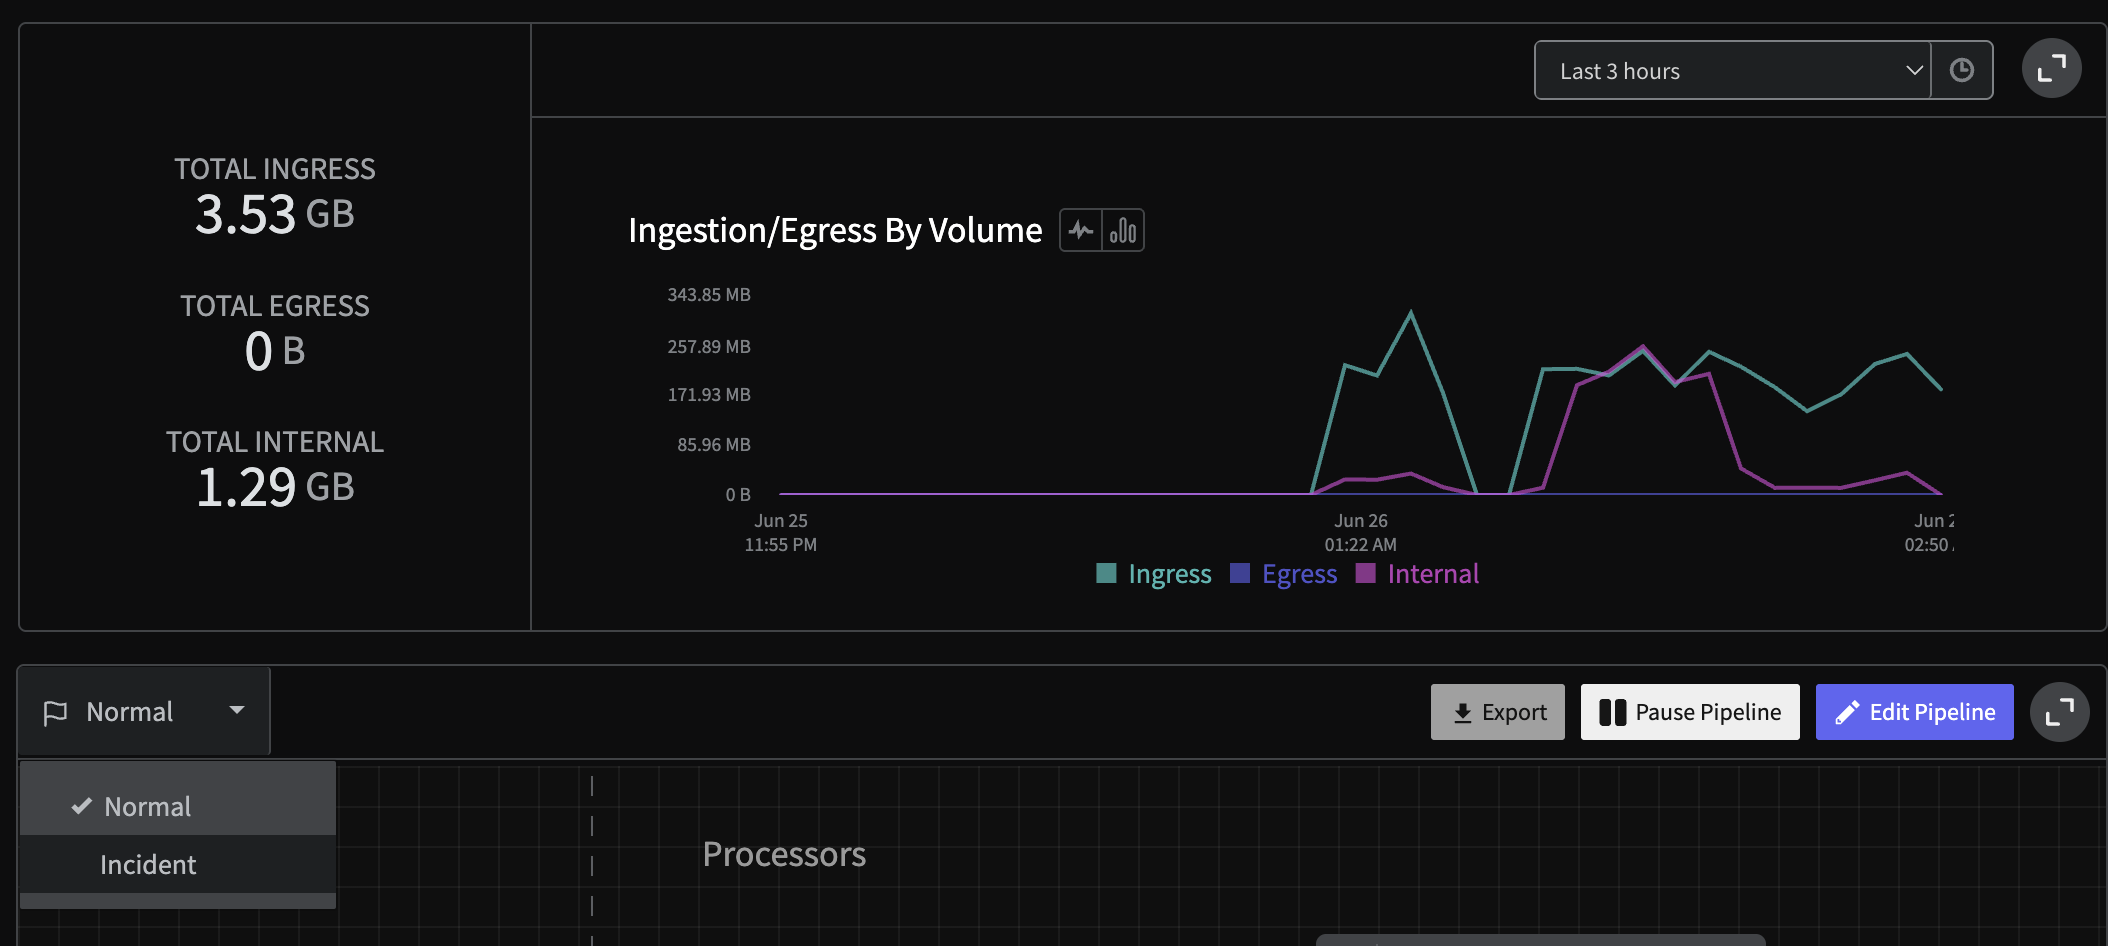 Now that this has been initiated, you will need to grab the
 Log Handler pipeline’s ID (found in the URL at app.mezmo.com/ACCOUNT_ID/pipelines/PIPELINE_ID) along with a Pipeline API Key here. Then, modify the following script with both that PIPELINE_ID and Pipeline API Key
Regions outside the USNote that for different deployment regions, the url will change slightly. For instance, in the EU one would use
https://api.eu.mezmo.com/v3/pipeline/state-variable?pipeline_id=PIPELINE_IDSTATE_ID for later. You will find it in the operational_state’s data packet, which should look something akin to
Step 11: View In Mezmo Log Analysis
Navigate to Log Analysis and view the incoming data. In particular, if you used thetag above you can simply search for tag:otel-demo.
Let’s look at the outcome of our prior Log Aggregation and Parsing.
First, look for the aggregated data by searching for tag:otel-demo "products found via product-catalog". Notice that instead of raw lines like we saw in the Profile, we now have an aggregated message to watch saving tens of thousands of log lines.
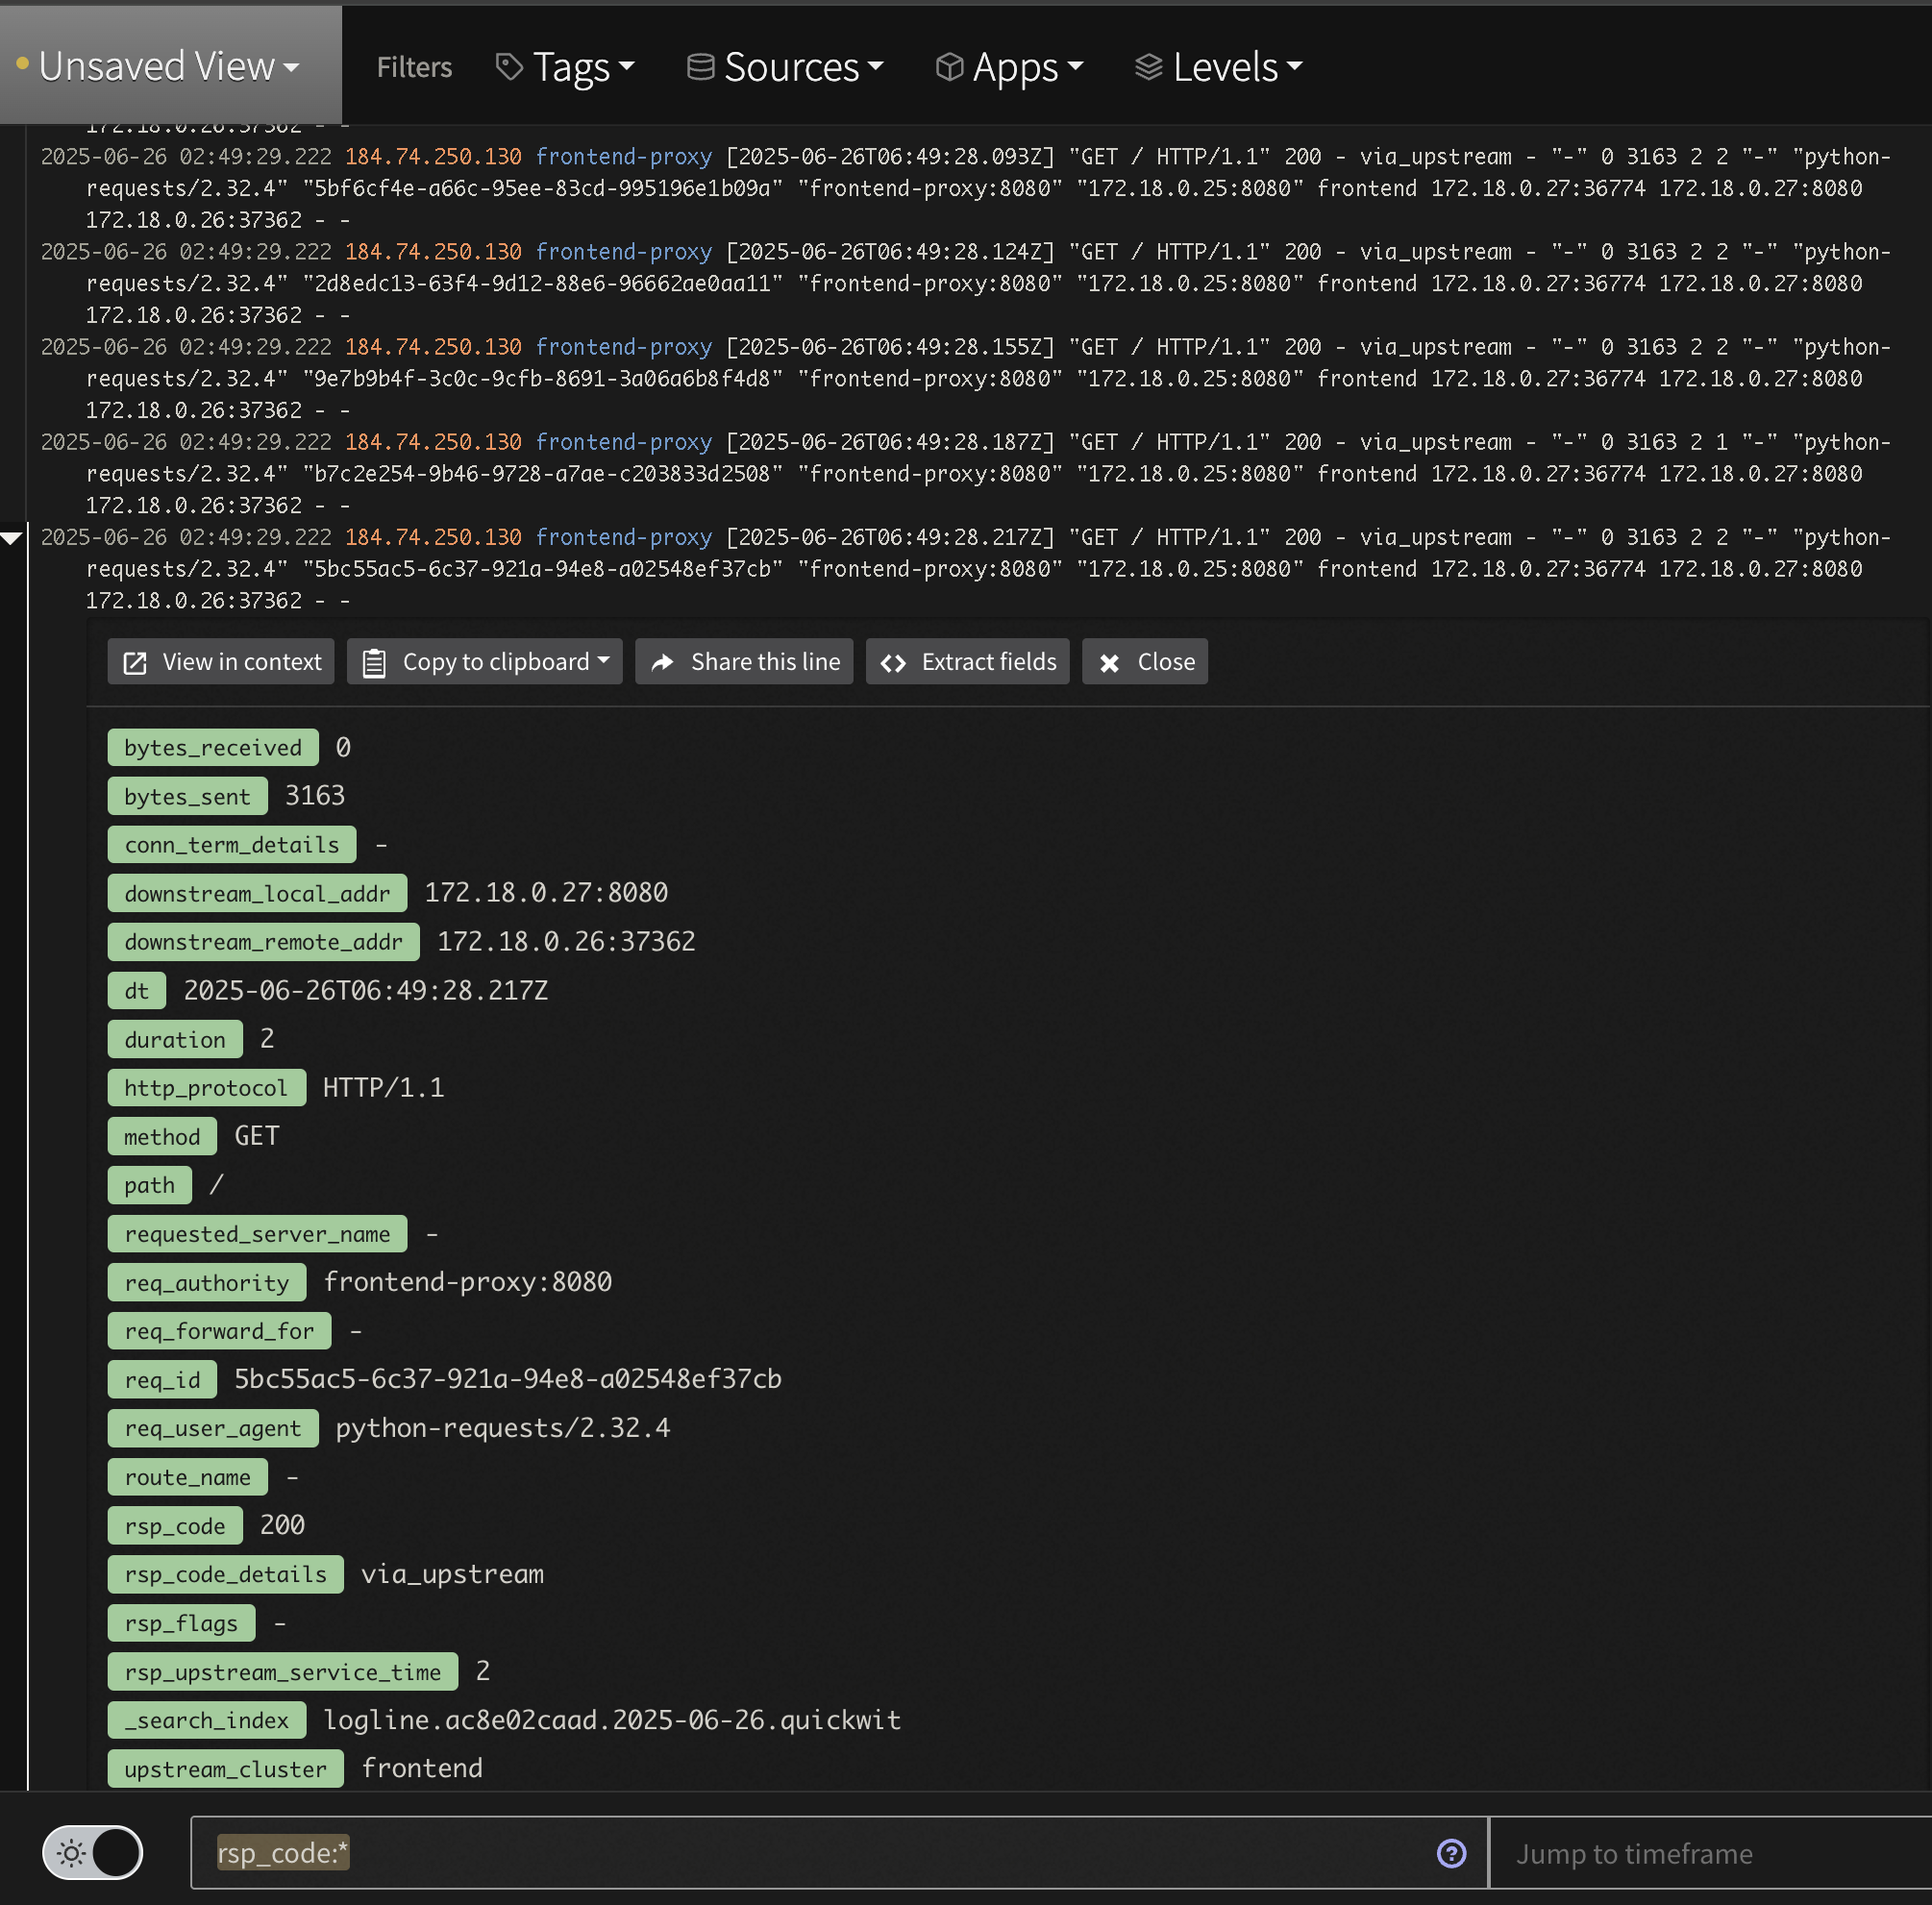
Second, check out the newly parsed data by searching for tag:otel-demo app:frontend-proxy. While logs are displayed nicely in the Log Viewer, one can expand a line and see all the nested structure that is easily searchable. For instance, to see all 2xx responses enter the query tag:otel-demo app:frontend-proxy rsp_code:(>=200 AND <300)
Learn About Log AnalysisIf you want to learn more about Log Analysis and creating things like saved Views, Alerts and more check out our docs here or reaching out to support@mezmo.com