Use this file to discover all available pages before exploring further.
As described in the Mezmo Whitepaper “Optimize Your Observability Data in Six Steps,” a simple way to reduce the overall volume of log data is to parse out routine messages, like Status 200messages, and then convert that data from events to metrics. Using this method, you can monitor these routine messages through a simple dashboard view, and then take action if you notice or are alerted to any anomalous spikes or decreases in these messages.This topic describe a basic Pipeline architecture and Processor group for converting events to metrics that you can adapt to your own purposes, with examples of Processor configurations.
You can see how data is processed and reduced through this Pipeline in this interactive version. You will need to have pop-ups enabled on your browser or for docs.mezmo.com to view the demo. You can view the demo without a pop-up at mezmo.com.<!— To open the pop-up on clicking a button, add the following data-navattic attributes to an existing button on your page —>
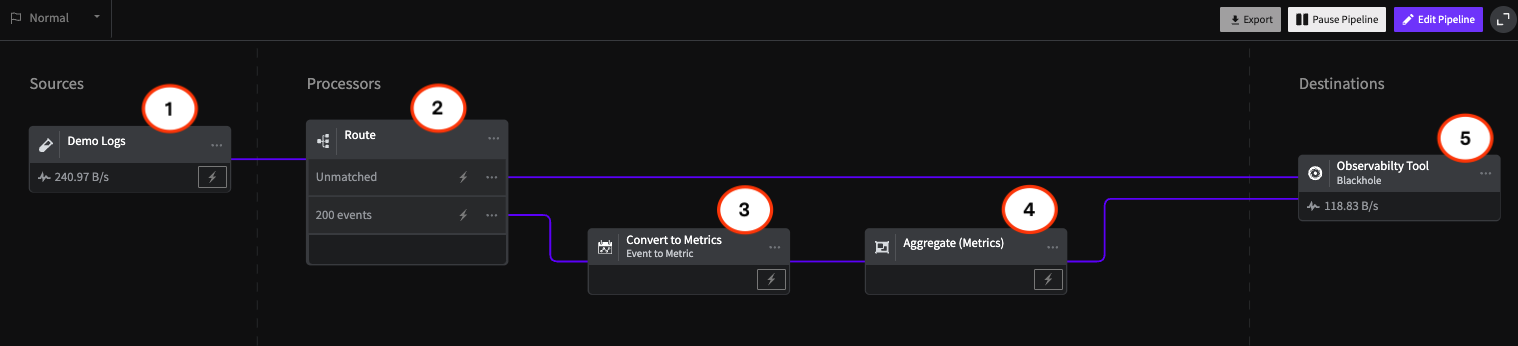
This schematic of the Pipeline illustrates the Processor chain for converting 200 events to metrics. The Processor configurations are described in detail in the sections that match the numbers in the schematic.
Log into the Mezmo App, and in the Pipelines section, click New Pipeline. > 2. Add the Demo Logs Source, and for Format, select JSON. > 3. Add the Blackhole Destination to your Pipeline, and connect it to the Demo Logs. > 4. Add the Processors and their configurations as shown in this example.> 5. To view the data transformations through the Processors, Deploy the Pipeline, and then click the Tap for the Source and each Processor to see the data as it egresses from each node. You will also be able to see how the data is reduced on the Pipeline Dashboard.> > If you don’t yet have a Mezmo account, you can sign up for a 30 Day Free Trial to try us out!
The Route Processor enables you to set conditions under which telemetry data will be sent to other points in the processing chain. In this case, it is set to send 200 events down the Processor Chain for conversion to metrics, while unmatched data is sent directly to the Destination. This example uses the Blackhole destination, where all data is dropped, but you could send matched and unmatched data to different destinations depending on your use case.
The Event to Metric Processor enables you implement a counter for the events sent to it, and attach tags to specified fields. In this case, the tags are sent to capture the values related to the URL and IP Address within the 200 event.
The final Processor in the chain, the Aggregate Processor aggregates multiple metric events into a single metric based on a defined time interval. In this case, it aggregates the value of the 200 metrics over a 10 second interval into a single number.
The Blackhole Destination drops all data sent to it. This makes it useful for testing your Processor chain to make sure you are getting the expected results before sending them on to a production destination. Mezmo supports a wide variety of popular destinations including Mezmo Log Analysis, Datadog Metrics, and Prometheus Remote Write.