

The SaaS version of Mezmo Telemetry Pipelines includes a Data Tap feature feature that enables you to view the flow of data through your Pipeline, and to confirm that the Processors are transforming and formatting the data as expected. This functionality is also available tapping remotely deployed Mezmo Edge instances. However, some organizations prefer to disable remote tapping to avoid the possibility of sensitive data leaving their network. In this case, you can leverage similar functionality in theDocumentation Index
Fetch the complete documentation index at: https://mezmo-9a59581a-mintlify-926f893d.mintlify.app/llms.txt
Use this file to discover all available pages before exploring further.
vector tap CLI, or GraphQL , to view the data for your local Edge Instance, without having to send any data to the Mezmo Web App.
Set Up Vector Tap with Mezmo Edge
The easiest way to get access tovector tap is to use a command line interface to connect to a running Edge node, which will have built-in vector tap connectivity and tools.
List Edge Nodes
Connect to a Named Node
exec is not available to your user in the cluster, you can use vector tap from any host with network connectivity to the cluster.
List Services
Forward the API Port
Tap Edge Data
View Data for All Nodes
You can use thevector tap to view data from combinations of node outputs in the Pipeline. The basic method is to view data at the output of every node:
View Data for a Specific Node
To view the data stream for a specific Pipeline component, you need to provide thecomponent id:
vector command to tap that node:
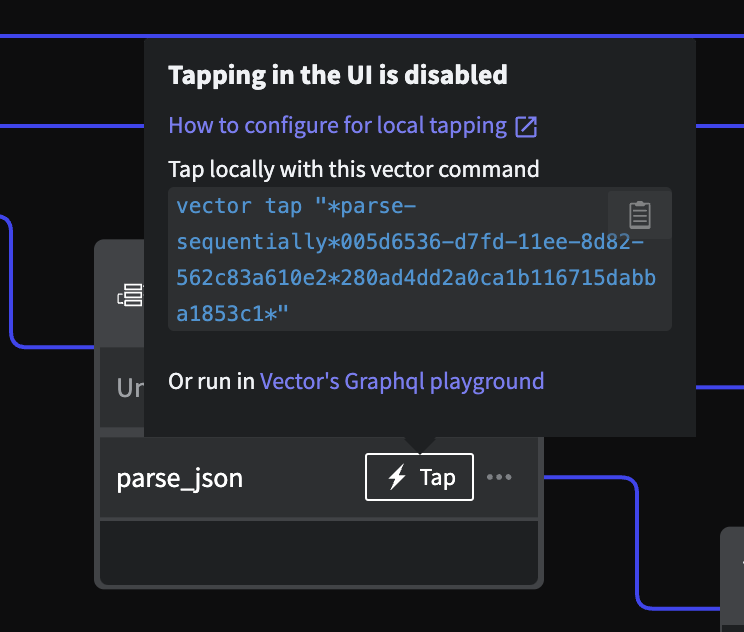 Click the copy/clipboard button to copy the command, which can be executed on the container or locally (with port forwarding active as described above).
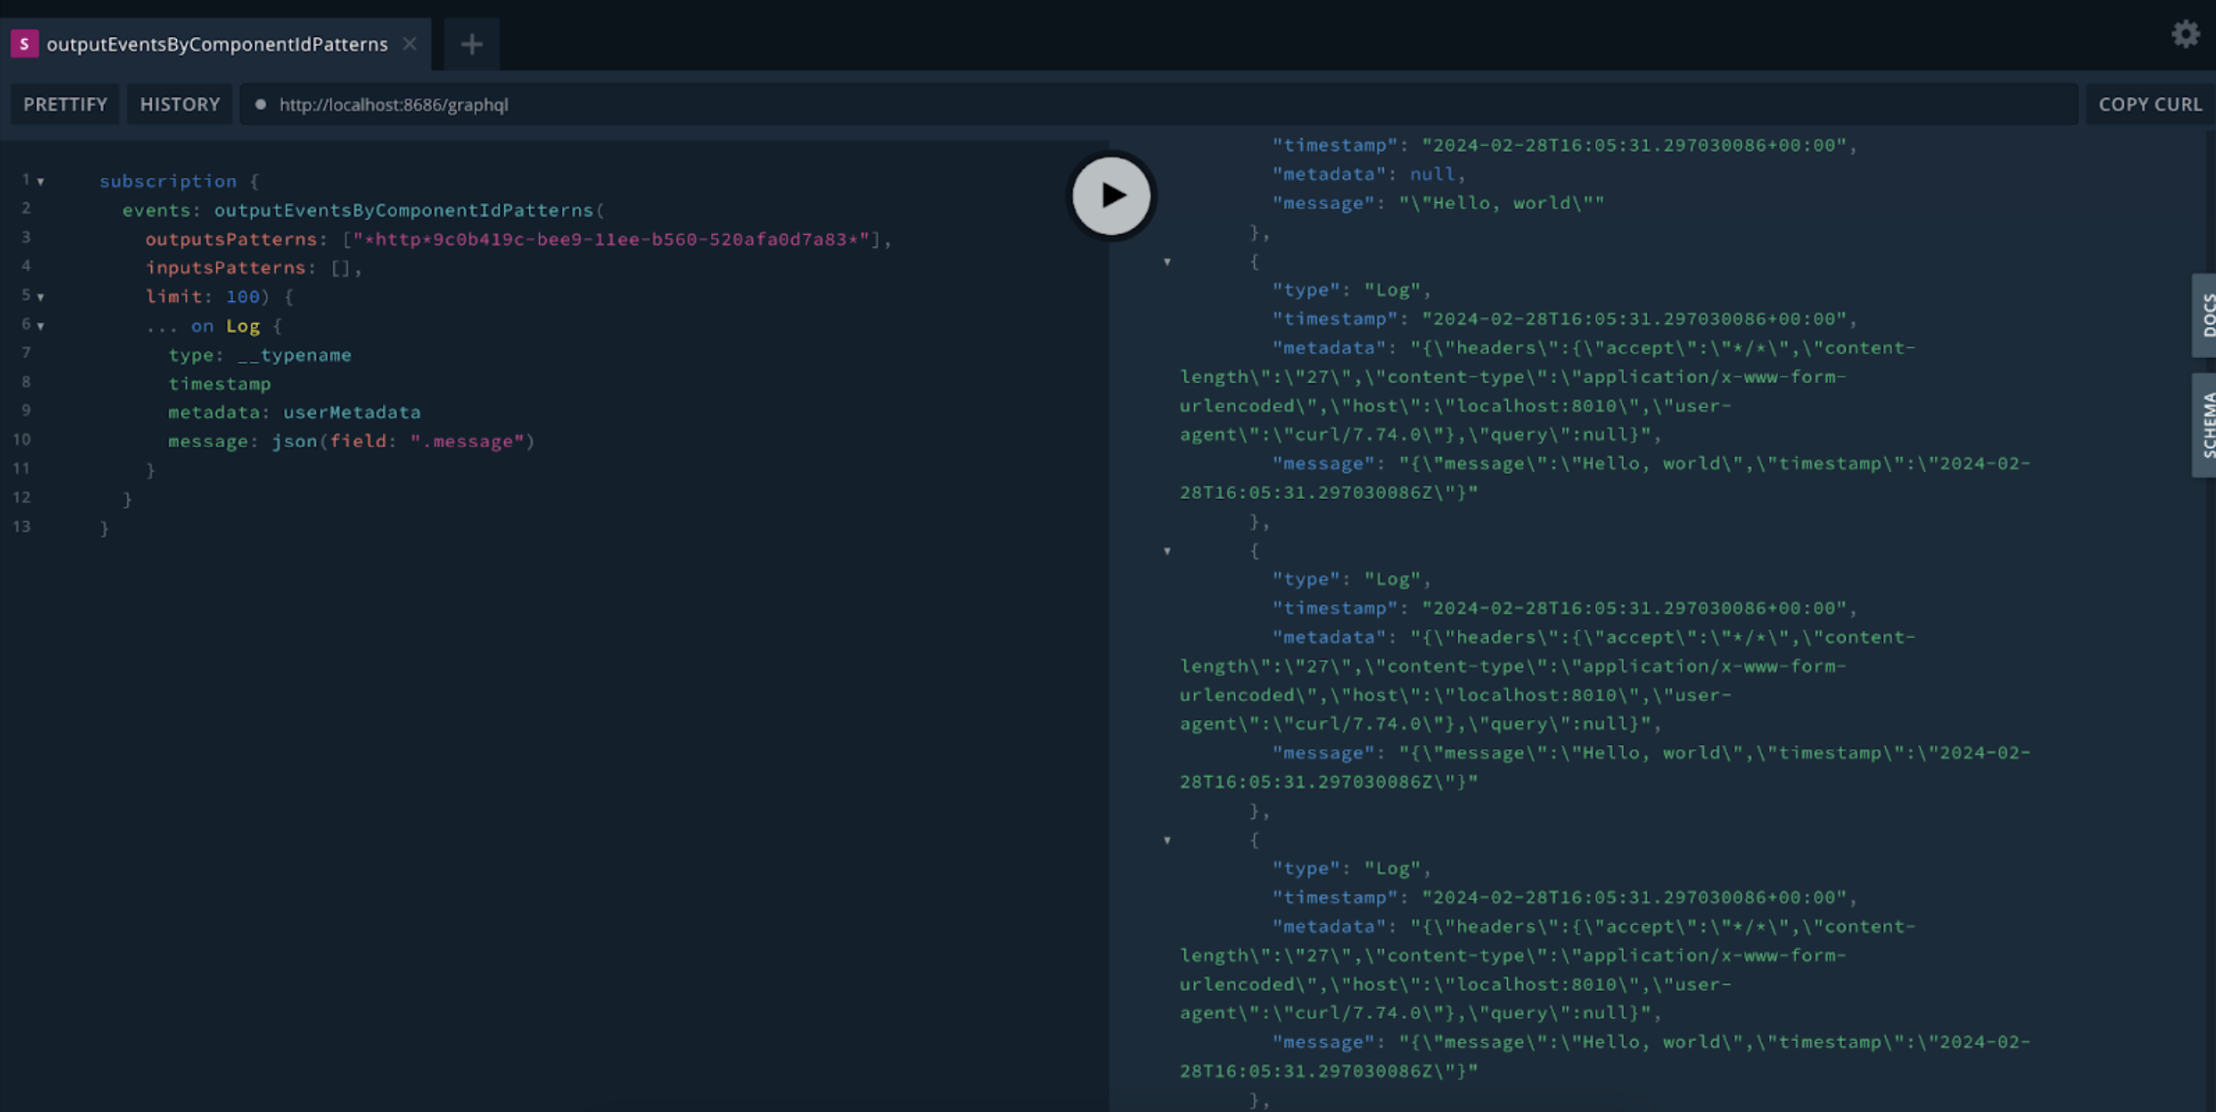
Alternatively, if port forwarding is active, you can click the Vector GraphQL playground link. This will open a new window that is connected to the GraphQL instance. The subscription query will be pre-populated with the selected node query, as shown in this screenshot:
Click the copy/clipboard button to copy the command, which can be executed on the container or locally (with port forwarding active as described above).
Alternatively, if port forwarding is active, you can click the Vector GraphQL playground link. This will open a new window that is connected to the GraphQL instance. The subscription query will be pre-populated with the selected node query, as shown in this screenshot:
Manually Constructing a Custom Tap
You can find the component id by viewing the Pipeline in the Mezmo Web App. Right-click on the component in the Pipeline Map, then click inspect.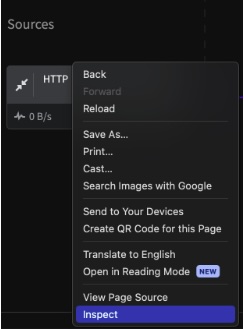 This will open the Dev Tools window, which will display a sub div of the component. Find
 data-nodeid, which will the UUID of the component.
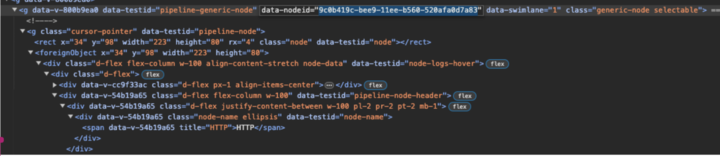 Enter the UUID of the component with wildcard characters and quotes:
http, you can tap just the component itself:
View Data for a Component with Multiple Outputs
View the Data for All Outputs
To view the data through the various transformations of a component with multiple outputs, like the Route Processor, use theroute command with the UUID of the component.
View the Data for a Single Output
To view the data for only one of the components outputs, you will need to use the child node ID. As with the node id, you can find the child ID node by using the Dev Tools to inspect the child node ID. Hover over the line containing the child node id, and the corresponding route in the Web App interface will be highlighted. You can use this to make sure you are selecting the correct child node id.
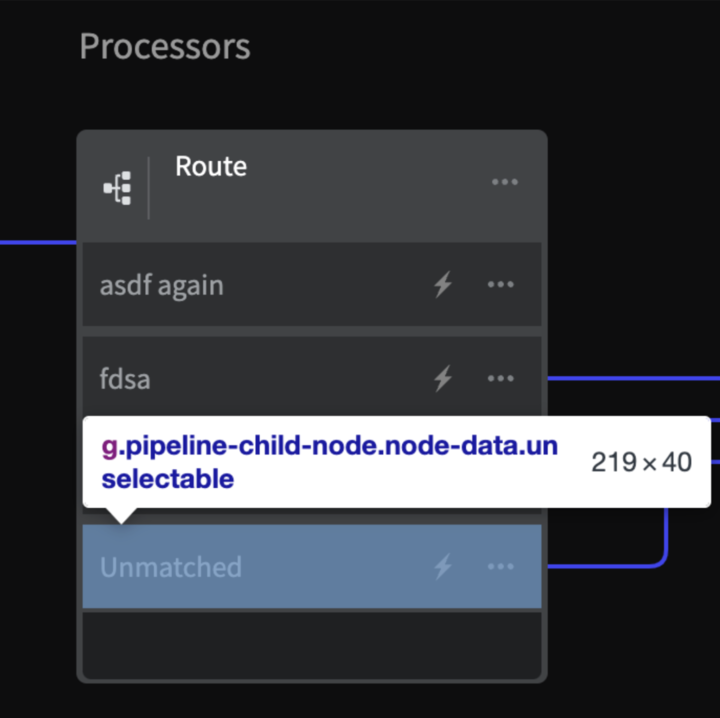 The syntax of the child
 data.nodeid is of the form <component id>.<route id>. Separate the two ids with an asterisk and add quotations to the full sting:
Using GraphQL
If you prefer, you can use the GraphQL Playground to inspect Edge Pipeline data. Follow the instructions for connecting Vector to your Edge instance described in the first section. After completing the step for Port Forwarding, use you browser to navigate to: http://localhost:8686/playground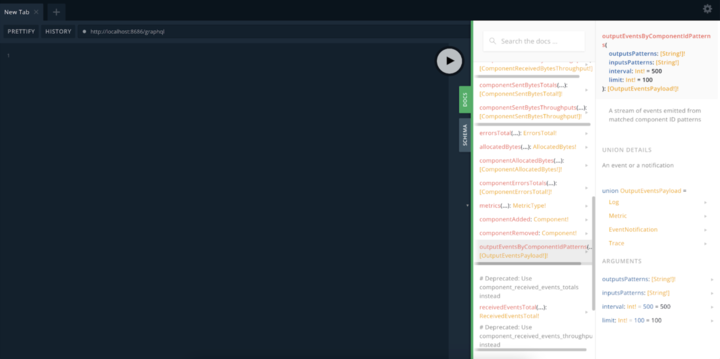 Obtain the component IDs as described in the previous section, and then use the
outputEventsByComponentIdPatterns to inspect the component.
This code sample shows the component ID within the outputsPatterns field:
Component Types Available for Inspection
| Source Type | Processor Type | Destination Type |
|---|---|---|
| azure-event-hub | clustering | alert-message |
| demo-logs | compact-fields | azure-blob-storage |
| fluent | decrypt-fields | blackhole |
| host-metrics | dedupe | clickhouse |
| http | drop-fields | cloudwatch-logs |
| kafka | encrypt-fields | cloudwatch-metrics |
| kubernetes-logs | filter | datadog-logs |
| mezmo-agent | flatten-fields | datadog-metrics |
| open-telemetry-logs | js-script | elasticsearch |
| open-telemetry-metrics | map-fields | gcp-cloud-monitoring |
| open-telemetry-traces | mask-pii | gcp-cloud-operations |
| splunk-hec | parse-sequentially | gcp-cloud-pubsub |
| syslog | parse | gcp-cloud-storage |
| reduce | honeycomb-logs | |
| route | http | |
| sample | indexed-search | |
| stringify | kafka | |
| unroll | kinesis-firehose | |
| vrl | kinesis-streams | |
| loki | ||
| mezmo | ||
| new-relic | ||
| prometheus-remote-write | ||
| pulsar | ||
| redis | ||
| s3 | ||
| splunk-hec-logs | ||
| sqs | ||
| sumo-logic-logs | ||
| sumo-logic-metrics | ||
| vector |
Disabling Tap from the Edge Helm Configuration
To disable tap from the Edge itself, simply edit thestatefulset and set two environment variables to https://localhost. This will cause the vector pod to emit error logs when it cannot fetch tasks, but otherwise functionality of the Edge instance is not affected other than to prevent data egress to the SaaS Control Plane from within an environment.
